2. Intro to Derivatives
Tangent Lines and Derivatives
2. Intro to Derivatives
Tangent Lines and Derivatives: Study with Video Lessons, Practice Problems & Examples
70PRACTICE PROBLEM
A scientist is studying the growth of a bacterial population in a lab culture. The experiment started at AM, and the table shows the population hours since the experiment started. The population size as a function of time is modeled by the curve below.

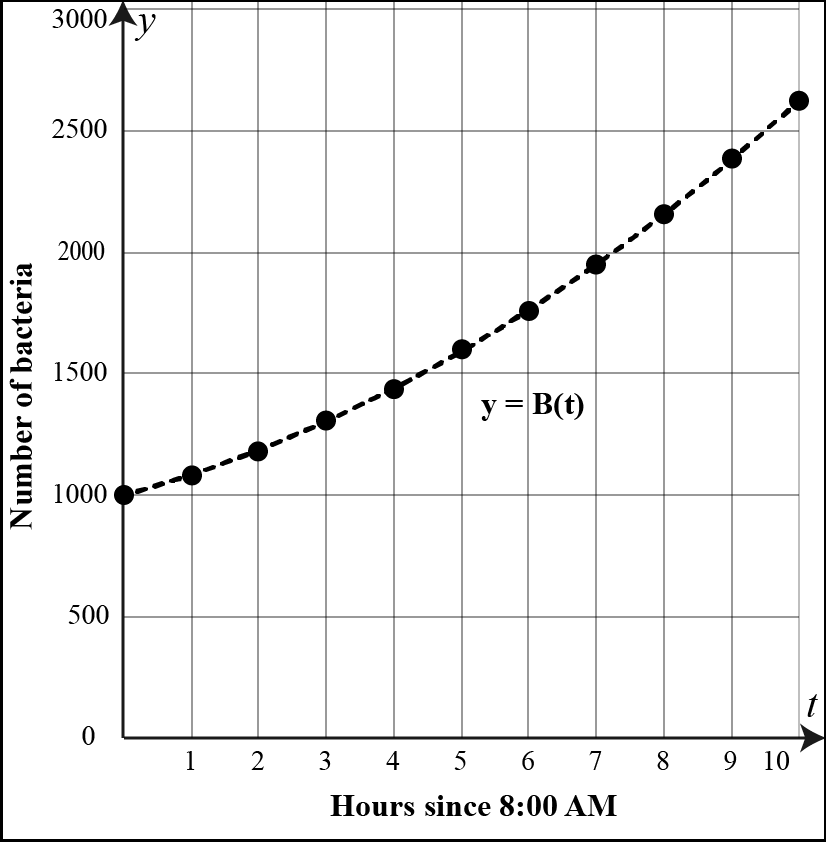
Calculate the average rate of the bacterial population growth from PM to PM.
A scientist is studying the growth of a bacterial population in a lab culture. The experiment started at AM, and the table shows the population hours since the experiment started. The population size as a function of time is modeled by the curve below.
Calculate the average rate of the bacterial population growth from PM to PM.