2. Intro to Derivatives
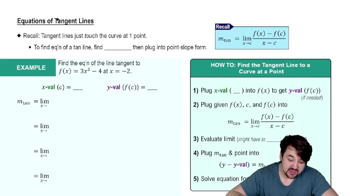
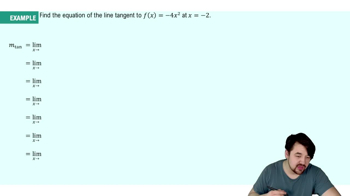
Tangent Lines and Derivatives
Problem 3.R.99a
Textbook Question
The population of the United States (in millions) by decade is given in the table, where t is the number of years after 1910. These data are plotted and fitted with a smooth curve y = p(t) in the figure. <IMAGE><IMAGE>
Compute the average rate of population growth from 1950 to 1960.
 Verified step by step guidance
1
Identify the values of t corresponding to the years 1950 and 1960. Since t is the number of years after 1910, for 1950, t = 40 and for 1960, t = 50.
Determine the population values p(40) and p(50) from the provided data or the fitted curve y = p(t).
Use the formula for the average rate of change, which is given by the expression: \( \text{Average Rate} = \frac{p(50) - p(40)}{50 - 40} \).
Substitute the values of p(40) and p(50) into the average rate of change formula to find the average rate of population growth.
Interpret the result in the context of the problem, understanding that the average rate of population growth represents the change in population per decade.
Recommended similar problem, with video answer:
Verified SolutionThis video solution was recommended by our tutors as helpful for the problem above
Video duration:
3mWas this helpful?

 5:13m
5:13mWatch next
Master Slopes of Tangent Lines with a bite sized video explanation from Nick
Start learningRelated Videos
Related Practice