2. Intro to Derivatives
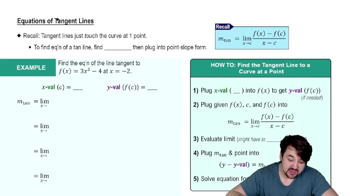
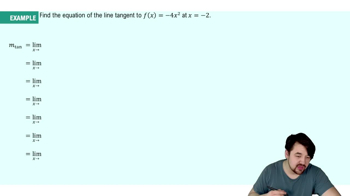
Tangent Lines and Derivatives
Problem 3.R.99a
Textbook Question
The population of the United States (in millions) by decade is given in the table, where t is the number of years after 1910. These data are plotted and fitted with a smooth curve y = p(t) in the figure. <IMAGE><IMAGE>
Compute the average rate of population growth from 1950 to 1960.
 Verified step by step guidance
1
Identify the years corresponding to 1950 and 1960 in terms of t, where t is the number of years after 1910. For 1950, t = 40, and for 1960, t = 50.
Find the population values from the table or the smooth curve y = p(t) for t = 40 and t = 50. Let's denote these populations as P(40) and P(50) respectively.
The average rate of population growth over a time interval [a, b] is given by the formula: \( \frac{P(b) - P(a)}{b - a} \). In this case, a = 40 and b = 50.
Substitute the values of P(50) and P(40) into the formula: \( \frac{P(50) - P(40)}{50 - 40} \).
Simplify the expression to find the average rate of population growth in millions per year over the decade from 1950 to 1960.
Verified video answer for a similar problem:This video solution was recommended by our tutors as helpful for the problem above
Video duration:
3mWas this helpful?
Key Concepts
Here are the essential concepts you must grasp in order to answer the question correctly.
Average Rate of Change
The average rate of change of a function over an interval measures how much the function's value changes per unit of input over that interval. It is calculated as the difference in the function's values at the endpoints of the interval divided by the difference in the input values. In this context, it represents the average population growth per year from 1950 to 1960.
Recommended video:

 06:37
06:37Average Value of a Function
Population Function
The population function, denoted as p(t), represents the population of the United States as a function of time, where t is the number of years since 1910. This function can be derived from the data provided and is typically modeled using polynomial or exponential functions to fit the historical population data. Understanding this function is crucial for calculating changes in population over specific time intervals.
Recommended video:
 06:21
06:21Properties of Functions
Definite Integral
A definite integral calculates the accumulation of quantities, such as population growth, over a specified interval. In this case, while the average rate of change can be computed directly, the definite integral can also be used to find the total change in population over the decade. This concept is foundational in calculus for understanding how functions behave over intervals and is often used in applications involving growth rates.
Recommended video:
 05:43
05:43Definition of the Definite Integral
 5:13m
5:13mWatch next
Master Slopes of Tangent Lines with a bite sized video explanation from Nick
Start learningRelated Videos
Related Practice