0. Functions
Graphs of Trigonometric Functions
Problem 62
Textbook Question
In Exercises 59–62, sketch the graph of the given function. What is the period of the function?
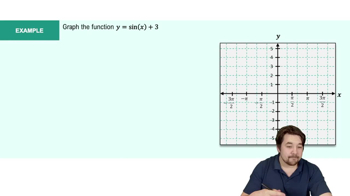
𝔂 = cos πx/2
 Verified step by step guidance
1
Step 1: Identify the function type. The given function is y = cos(πx/2), which is a cosine function. Cosine functions are periodic and have a characteristic wave-like shape.
Step 2: Determine the period of the function. The period of a cosine function y = cos(bx) is given by the formula: <math xmlns="http://www.w3.org/1998/Math/MathML"><mfrac><mn>2</mn><mi>π</mi></mfrac></math>. For y = cos(πx/2), b = π/2, so the period is <math xmlns="http://www.w3.org/1998/Math/MathML"><mfrac><mn>2</mn><mi>π</mi></mfrac> * <mfrac><mn>2</mn><mi>π</mi></mfrac> = 4.</math>
Step 3: Sketch the graph. Start by plotting key points of the cosine function within one period. For y = cos(πx/2), the period is 4, so plot points at x = 0, 1, 2, 3, and 4. At x = 0, y = cos(0) = 1; at x = 2, y = cos(π) = -1; at x = 4, y = cos(2π) = 1.
Step 4: Draw the wave pattern. Connect the plotted points with a smooth curve to form the cosine wave. The graph should start at y = 1, dip to y = -1 at x = 2, and return to y = 1 at x = 4, completing one full cycle.
Step 5: Extend the graph. Since the cosine function is periodic, repeat the wave pattern for additional cycles to the left and right of the initial period, maintaining the same amplitude and period.
Verified video answer for a similar problem:This video solution was recommended by our tutors as helpful for the problem above
Video duration:
6mWas this helpful?
Key Concepts
Here are the essential concepts you must grasp in order to answer the question correctly.
Period of a Function
The period of a function is the length of the interval over which the function repeats itself. For trigonometric functions like cosine, the period can be determined from the coefficient of the variable inside the function. Specifically, for the cosine function, the standard period is 2π, but it can be adjusted based on the function's equation.
Recommended video:
 6:22
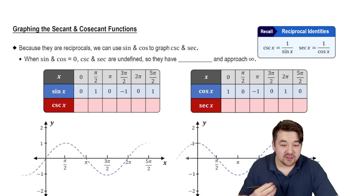
6:22Graphs of Secant and Cosecant Functions
Graphing Trigonometric Functions
Graphing trigonometric functions involves understanding their key features, such as amplitude, period, phase shift, and vertical shift. For the cosine function, the graph oscillates between -1 and 1, with peaks at the maximum and minimum values. Identifying these characteristics helps in accurately sketching the graph.
Recommended video:
 6:04
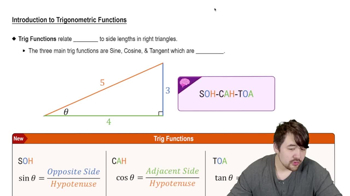
6:04Introduction to Trigonometric Functions
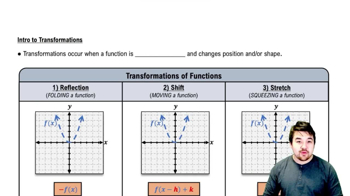
Transformations of Functions
Transformations of functions refer to changes made to the basic function to alter its graph. This includes vertical and horizontal shifts, stretching, and compressing. In the case of 𝔶 = cos(πx/2), the coefficient π/2 affects the period and can also influence the graph's appearance, requiring careful consideration when sketching.
Recommended video:
 5:25
5:25Intro to Transformations
 5:53m
5:53mWatch next
Master Graph of Sine and Cosine Function with a bite sized video explanation from Nick
Start learningRelated Videos
Related Practice