Table of contents
- 0. Functions7h 55m
- Introduction to Functions18m
- Piecewise Functions10m
- Properties of Functions9m
- Common Functions1h 8m
- Transformations5m
- Combining Functions27m
- Exponent rules32m
- Exponential Functions28m
- Logarithmic Functions24m
- Properties of Logarithms36m
- Exponential & Logarithmic Equations35m
- Introduction to Trigonometric Functions38m
- Graphs of Trigonometric Functions44m
- Trigonometric Identities47m
- Inverse Trigonometric Functions48m
- 1. Limits and Continuity2h 2m
- 2. Intro to Derivatives1h 33m
- 3. Techniques of Differentiation3h 18m
- 4. Applications of Derivatives2h 38m
- 5. Graphical Applications of Derivatives6h 2m
- 6. Derivatives of Inverse, Exponential, & Logarithmic Functions2h 37m
- 7. Antiderivatives & Indefinite Integrals1h 26m
- 8. Definite Integrals4h 44m
- 9. Graphical Applications of Integrals2h 27m
- 10. Physics Applications of Integrals 3h 16m
- 11. Integrals of Inverse, Exponential, & Logarithmic Functions2h 31m
- 12. Techniques of Integration7h 41m
- 13. Intro to Differential Equations2h 55m
- 14. Sequences & Series5h 36m
- 15. Power Series2h 19m
- 16. Parametric Equations & Polar Coordinates7h 58m
0. Functions
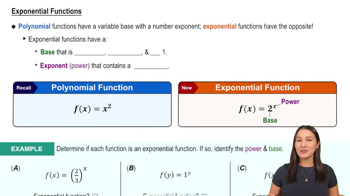
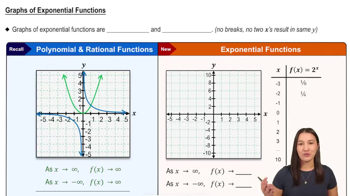
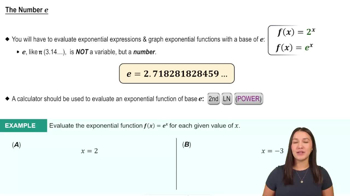
Exponential Functions


Graphing Exponential Functions Example 1
Callie
Video duration:
3mPlay a video:
Related Videos
Related Practice
 4:47
4:47