5. Graphical Applications of Derivatives
Curve Sketching
Problem 4.4.36
Textbook Question
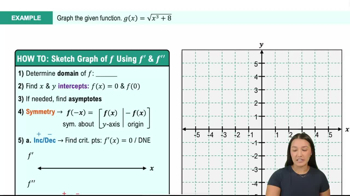
Graphing functions Use the guidelines of this section to make a complete graph of f.
f(x) = ln (x² + 1)
 Verified step by step guidance
1
Step 1: Identify the domain of the function f(x) = ln(x² + 1). Since the argument of the natural logarithm, x² + 1, is always positive for all real x, the domain of f(x) is all real numbers.
Step 2: Determine the critical points by finding the derivative of f(x). The derivative is f'(x) = (2x)/(x² + 1). Set f'(x) = 0 to find critical points, which occurs when 2x = 0, giving x = 0.
Step 3: Analyze the behavior of f(x) at the critical point and intervals. Use the first derivative test to determine if x = 0 is a local minimum or maximum by checking the sign of f'(x) on intervals around x = 0.
Step 4: Find the second derivative, f''(x), to analyze concavity. The second derivative is f''(x) = (2(x² - 1))/(x² + 1)². Determine where f''(x) is positive (concave up) or negative (concave down) to identify inflection points.
Step 5: Sketch the graph using the information from the previous steps. Plot the critical point, analyze the concavity, and ensure the graph reflects the behavior of f(x) as x approaches positive and negative infinity.
Verified video answer for a similar problem:This video solution was recommended by our tutors as helpful for the problem above
Video duration:
11mWas this helpful?
Key Concepts
Here are the essential concepts you must grasp in order to answer the question correctly.
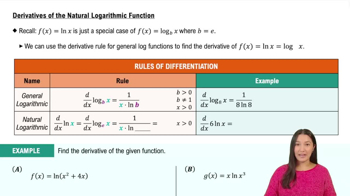
Natural Logarithm
The natural logarithm, denoted as ln, is the logarithm to the base e, where e is approximately 2.71828. It is a fundamental function in calculus, particularly in relation to growth and decay processes. Understanding its properties, such as its domain (all positive real numbers) and its behavior as x approaches infinity or zero, is crucial for graphing functions involving ln.
Recommended video:
 05:18
05:18Derivative of the Natural Logarithmic Function
Graphing Techniques
Graphing techniques involve understanding how to represent a function visually on a coordinate plane. This includes identifying key features such as intercepts, asymptotes, and the overall shape of the graph. For the function f(x) = ln(x² + 1), recognizing that x² + 1 is always positive helps in determining the domain and range of the function, which is essential for accurate graphing.
Recommended video:
 06:15
06:15Graphing The Derivative
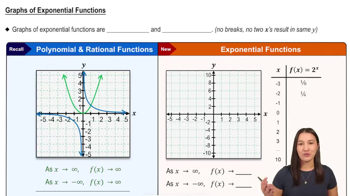
Behavior of Functions
Analyzing the behavior of functions involves studying their limits, continuity, and differentiability. For f(x) = ln(x² + 1), it is important to evaluate how the function behaves as x approaches positive and negative infinity, as well as at critical points. This understanding aids in predicting the function's growth and identifying any local maxima or minima, which are key to creating a complete graph.
Recommended video:
 5:46
5:46Graphs of Exponential Functions
 11:41m
Watch next
Master Summary of Curve Sketching with a bite sized video explanation from Callie
Start learning