1. Limits and Continuity
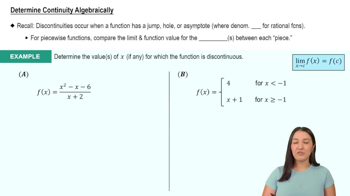
Continuity
Problem 3.2.19a
Textbook Question
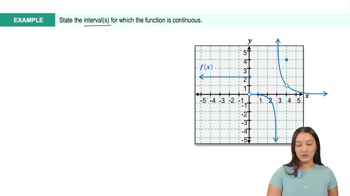
Use the graph of f in the figure to do the following. <IMAGE>
a. Find the values of x in (-2,2) at which f is not continuous.
 Verified step by step guidance
1
Step 1: Understand the concept of continuity. A function f(x) is continuous at a point x = a if the following three conditions are met: (1) f(a) is defined, (2) the limit of f(x) as x approaches a exists, and (3) the limit of f(x) as x approaches a is equal to f(a).
Step 2: Examine the graph of f(x) over the interval (-2, 2). Look for any points where the function might not be continuous. These could be points where there is a jump, a hole, or a vertical asymptote in the graph.
Step 3: Identify any points of discontinuity. A point of discontinuity is where at least one of the conditions for continuity is not satisfied. Check for any breaks in the graph, such as gaps or jumps.
Step 4: Verify the type of discontinuity at each identified point. Determine if the discontinuity is removable (a hole in the graph), a jump (a sudden change in function value), or an infinite discontinuity (a vertical asymptote).
Step 5: List the x-values in the interval (-2, 2) where the function f(x) is not continuous, based on your observations from the graph.
Recommended similar problem, with video answer:
Verified SolutionThis video solution was recommended by our tutors as helpful for the problem above
Video duration:
3mWas this helpful?


Related Videos
Related Practice