Textbook Question
In Exercises 9–16, determine whether the function is even, odd, or neither.
𝔂 = x⁴ + 1
x³ - 2x
227
views
 Verified step by step guidance
 5:53
5:53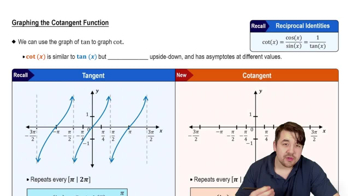 5:37
5:37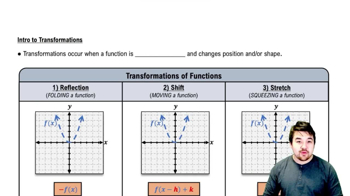 5:25
5:25In Exercises 9–16, determine whether the function is even, odd, or neither.
𝔂 = x⁴ + 1
x³ - 2x
Graph the functions in Exercises 37–56.
y = (x + 2)³/² + 1
In Exercises 19–32, find the (a) domain and (b) range.
𝔂 = cos(x - 3) + 1
Graph the functions in Exercises 13–22. What is the period of each function?
−cos 2πx
A pen in the shape of an isosceles right triangle with legs of length x ft and hypotenuse of length h ft is to be built. If fencing costs \$5/ft for the legs and \$10/ft for the hypotenuse, write the total cost C of construction as a function of h.
Graphing
In Exercises 69–76, graph each function not by plotting points, but by starting with the graph of one of the standard functions presented in Figures 1.14–1.17 and applying an appropriate transformation.
y = (1/2x) − 1