0. Functions
Introduction to Functions
Problem 41c
Textbook Question
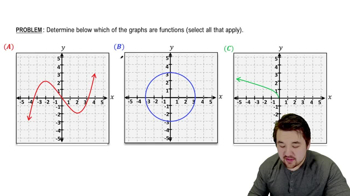
Velocity from position The graph of represents the position of an object moving along a line at time . <IMAGE>
c. Sketch a graph of the velocity function.
 Verified step by step guidance
1
Understand that velocity is the derivative of the position function with respect to time. This means we need to find f'(t) from the given position function f(t).
Identify key features of the position graph such as intervals where the function is increasing, decreasing, or constant. These features will help determine the behavior of the velocity graph.
For intervals where the position graph is increasing, the velocity will be positive. For intervals where the position graph is decreasing, the velocity will be negative. If the position graph is constant, the velocity will be zero.
Determine the points where the position graph has a maximum or minimum, as these will correspond to points where the velocity graph crosses the t-axis (velocity is zero).
Sketch the velocity graph using the information gathered: positive velocity for increasing intervals, negative velocity for decreasing intervals, and zero velocity for constant intervals. Ensure the graph reflects changes in the slope of the position graph.
Verified video answer for a similar problem:This video solution was recommended by our tutors as helpful for the problem above
Video duration:
2mWas this helpful?
Key Concepts
Here are the essential concepts you must grasp in order to answer the question correctly.
Position Function
The position function, denoted as s = f(t), describes the location of an object along a line at any given time t. It provides a mathematical representation of how the position changes over time, which is essential for understanding motion. Analyzing this function allows us to determine the object's behavior, such as when it is moving forward or backward.
Recommended video:

 5:20
5:20Relations and Functions
Velocity
Velocity is the rate of change of the position function with respect to time, mathematically expressed as v(t) = f'(t). It indicates both the speed and direction of the object's movement. Understanding how to derive the velocity from the position function is crucial for sketching the velocity graph, as it reveals how quickly and in which direction the object is moving at any moment.
Recommended video:
 06:29
06:29Derivatives Applied To Velocity
Graphing Functions
Graphing functions involves plotting the relationship between variables on a coordinate system, which helps visualize their behavior. For the velocity function, this means representing v(t) against time t. A clear understanding of how to interpret and create graphs is vital for analyzing motion, as it allows one to see trends, such as acceleration or deceleration, in the object's movement.
Recommended video:
 5:53
5:53Graph of Sine and Cosine Function
 1:36m
1:36mWatch next
Master Introduction to Calculus Channel with a bite sized video explanation from Callie
Start learning