0. Functions
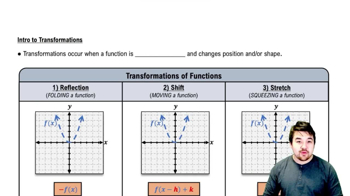
Transformations
Problem 53f
Textbook Question
Shifting and Scaling Graphs
Suppose the graph of g is given. Write equations for the graphs that are obtained from the graph of g by shifting, scaling, or reflecting, as indicated.
f. Compress horizontally by a factor of 5
 Verified step by step guidance
1
Identify the original function g(x) that represents the graph you are working with.
To compress the graph horizontally by a factor of 5, you need to modify the input of the function g. This is done by replacing x with x/5 in the function.
Write the new function as g(x/5) to represent the horizontal compression.
Understand that compressing horizontally by a factor of 5 means that for every x-value in the original graph, the corresponding y-value will now occur at x/5 in the new graph.
Finally, ensure that you can visualize how the graph will appear after this transformation, noting that it will be 'squeezed' towards the y-axis.
Was this helpful?

 5:25m
5:25mWatch next
Master Intro to Transformations with a bite sized video explanation from Nick
Start learningRelated Videos
Related Practice