
Ch. 4 - Applications of the Derivative
Briggs - Calculus: Early Transcendentals 3rd Edition
Briggs3rd EditionCalculus: Early TranscendentalsISBN: 9780136847243Not the one you use?Change textbook
Chapter 4, Problem 3

Sketch the graph of a function continuous on the given interval that satisfies the following conditions.
ƒ is continuous on the interval [-4, 4] ; f'(x) = 0 for x = -2, 0, and 3; ƒ has an absolute minimum at x = 3; ƒ has a local minimum at x = -2 ; ƒ has a local maximum at x = 0; ƒ has an absolute maximum at x = -4.

Verified step by step guidance
1
Identify the critical points where the derivative f'(x) = 0, which are x = -2, 0, and 3. These points are where the function could have local maxima, minima, or points of inflection.
Determine the nature of each critical point using the given conditions: x = -2 is a local minimum, x = 0 is a local maximum, and x = 3 is an absolute minimum.
Consider the endpoints of the interval [-4, 4]. The function has an absolute maximum at x = -4, which means the function value at this point is greater than or equal to the function values at all other points in the interval.
Sketch the graph by plotting the critical points and endpoints, ensuring that the function is continuous across the interval. Start at the absolute maximum at x = -4, decrease to the local minimum at x = -2, increase to the local maximum at x = 0, decrease again to the absolute minimum at x = 3, and then continue to x = 4.
Ensure the graph reflects the continuity of the function across the interval [-4, 4] and that the behavior at each critical point matches the specified conditions (local and absolute extrema).

Verified video answer for a similar problem:

This video solution was recommended by our tutors as helpful for the problem above.
Video duration:
7m
Was this helpful?

Key Concepts

Here are the essential concepts you must grasp in order to answer the question correctly.

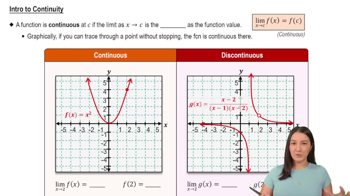
Continuity of Functions

A function is continuous on an interval if there are no breaks, jumps, or holes in its graph within that interval. This means that for every point in the interval, the function approaches a limit that equals the function's value at that point. Understanding continuity is crucial for sketching graphs, as it ensures that the function behaves predictably across the specified range.
Recommended video:
05:34
Intro to Continuity

Critical Points and Extrema

Critical points occur where the derivative of a function is zero or undefined, indicating potential local maxima or minima. In this question, the critical points at x = -2, 0, and 3 are essential for determining the function's behavior. An absolute minimum or maximum refers to the lowest or highest value of the function over the entire interval, while local extrema are the highest or lowest points in a small neighborhood around the critical points.
Recommended video:
04:50
Critical Points

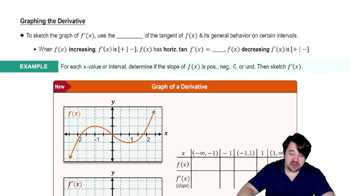
Graphing Techniques

Graphing techniques involve plotting points, identifying key features such as intercepts, and understanding the shape of the function based on its derivatives. For this question, sketching the graph requires incorporating the identified critical points and the specified conditions of local and absolute extrema, ensuring that the graph reflects the function's continuity and the behavior at those points.
Recommended video:
06:15
Graphing The Derivative