5. Graphical Applications of Derivatives
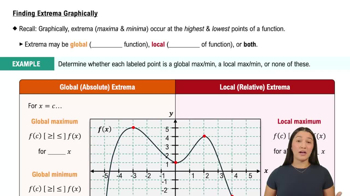
Intro to Extrema
Problem 4.R.2c
Textbook Question
Locating extrema Consider the graph of a function ƒ on the interval [-3, 3]. <IMAGE>
c. Give the approximate coordinates of the inflection point(s) of f.
 Verified step by step guidance
1
Understand that an inflection point is where the function changes concavity, which means the second derivative changes sign.
Examine the graph visually to identify where the curve changes from concave up to concave down or vice versa.
Look for points on the graph where the slope of the tangent line changes from increasing to decreasing or vice versa, indicating a change in concavity.
Estimate the x-coordinate of the inflection point by observing the graph and noting where this change occurs.
Approximate the y-coordinate by finding the corresponding value of the function at the estimated x-coordinate.
Verified video answer for a similar problem:This video solution was recommended by our tutors as helpful for the problem above
Video duration:
2mWas this helpful?
Key Concepts
Here are the essential concepts you must grasp in order to answer the question correctly.
Inflection Points
Inflection points are points on the graph of a function where the curvature changes direction. This means that the second derivative of the function changes sign at these points. Identifying inflection points is crucial for understanding the behavior of the function, particularly in determining where it transitions from concave up to concave down or vice versa.
Recommended video:

 04:50
04:50Critical Points
Second Derivative Test
The second derivative test is a method used to determine the concavity of a function at a given point. If the second derivative is positive, the function is concave up, and if it is negative, the function is concave down. An inflection point occurs where the second derivative equals zero or is undefined, indicating a potential change in concavity.
Recommended video:
 06:02
06:02The Second Derivative Test: Finding Local Extrema
Graphical Analysis
Graphical analysis involves examining the visual representation of a function to identify key features such as extrema, inflection points, and intervals of increase or decrease. By analyzing the graph, one can estimate the coordinates of inflection points and understand the overall behavior of the function across the specified interval.
Recommended video:
 05:02
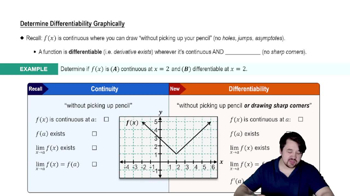
05:02Determining Differentiability Graphically
 5:58m
5:58mWatch next
Master Finding Extrema Graphically with a bite sized video explanation from Callie
Start learning