5. Graphical Applications of Derivatives
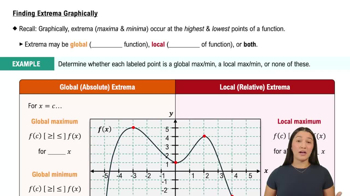
Intro to Extrema
Problem 4.4.57
Textbook Question
Functions from derivatives Use the derivative f' to determine the x-coordinates of the local maxima and minima of f, and the intervals on which f is increasing or decreasing. Sketch a possible graph of f (f is not unique).
f'(x) = 10 sin 2x on [-2π, 2π]
 Verified step by step guidance
1
Identify the critical points by setting the derivative f'(x) = 10 sin(2x) equal to zero and solving for x. This gives the equation 10 sin(2x) = 0, which simplifies to sin(2x) = 0.
Solve sin(2x) = 0 for x. The general solution for sin(θ) = 0 is θ = nπ, where n is an integer. Therefore, 2x = nπ, leading to x = nπ/2.
Determine the specific critical points within the interval [-2π, 2π] by substituting integer values for n. Calculate x for n = -4, -3, -2, -1, 0, 1, 2, 3, 4.
Use the first derivative test to classify each critical point as a local maximum, local minimum, or neither. Evaluate the sign of f'(x) on intervals between the critical points to determine where f is increasing or decreasing.
Sketch a possible graph of f by plotting the critical points and indicating the intervals of increase and decrease. Use the behavior of the sine function and the periodicity of f'(x) to guide the shape of the graph.
Verified video answer for a similar problem:This video solution was recommended by our tutors as helpful for the problem above
Video duration:
8mWas this helpful?
Key Concepts
Here are the essential concepts you must grasp in order to answer the question correctly.
Derivatives and Critical Points
The derivative of a function, denoted as f'(x), represents the rate of change of the function at any point. Critical points occur where the derivative is zero or undefined, indicating potential local maxima or minima. To find these points, we set f'(x) = 0 and solve for x, which helps identify where the function's behavior changes.
Recommended video:

 04:50
04:50Critical Points
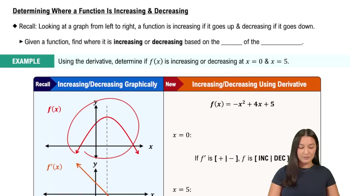
Increasing and Decreasing Intervals
The intervals on which a function is increasing or decreasing can be determined by analyzing the sign of its derivative. If f'(x) > 0, the function is increasing on that interval; if f'(x) < 0, it is decreasing. This analysis helps in understanding the overall shape and behavior of the function across its domain.
Recommended video:
 07:32
07:32Determining Where a Function is Increasing & Decreasing
Graph Sketching
Sketching a graph of a function involves plotting its critical points, identifying intervals of increase and decrease, and considering the behavior at the endpoints of the interval. While the exact graph may not be unique, understanding the function's key features allows for a reasonable approximation of its shape, reflecting local maxima, minima, and overall trends.
Recommended video:
 11:41
11:41Summary of Curve Sketching
 5:58m
5:58mWatch next
Master Finding Extrema Graphically with a bite sized video explanation from Callie
Start learning