The following equations implicitly define one or more functions. c. Use the functions found in part (b) to graph the given equation. x+y³−xy=1 (Hint: Rewrite as y³−1=xy−x and then factor both sides.)
Verified step by step guidance
1
Start by rewriting the given equation as suggested: \( y^3 - 1 = xy - x \). This sets up the equation for factoring.
Factor the left side of the equation \( y^3 - 1 \) using the difference of cubes formula: \( y^3 - 1 = (y - 1)(y^2 + y + 1) \).
Factor the right side of the equation \( xy - x \) by taking out the common factor \( x \): \( xy - x = x(y - 1) \).
Set the factored forms equal to each other: \( (y - 1)(y^2 + y + 1) = x(y - 1) \).
To find the functions, consider the case where \( y - 1 \neq 0 \) and divide both sides by \( y - 1 \), resulting in \( y^2 + y + 1 = x \). This gives the function \( x = y^2 + y + 1 \).
Verified video answer for a similar problem:
This video solution was recommended by our tutors as helpful for the problem above
Video duration:
5m
Play a video:
0 Comments
Key Concepts
Here are the essential concepts you must grasp in order to answer the question correctly.
Implicit Functions
Implicit functions are defined by equations where the dependent variable is not isolated on one side. In the context of calculus, understanding how to manipulate these equations is crucial for finding explicit forms of functions or for analyzing their properties. The equation given, x + y³ - xy = 1, is an example where y is implicitly defined in terms of x.
Factoring is the process of breaking down an expression into simpler components, or factors, that when multiplied together yield the original expression. In the context of the given equation, rewriting it as y³ - 1 = xy - x allows for easier manipulation and understanding of the relationship between x and y, which is essential for graphing the function.
Graphing functions involves plotting points on a coordinate system to visually represent the relationship between variables. For the equation derived from the implicit function, understanding how to graph y in terms of x after factoring is key to visualizing the behavior of the function. This process often requires identifying key features such as intercepts and asymptotes.

 Verified step by step guidance
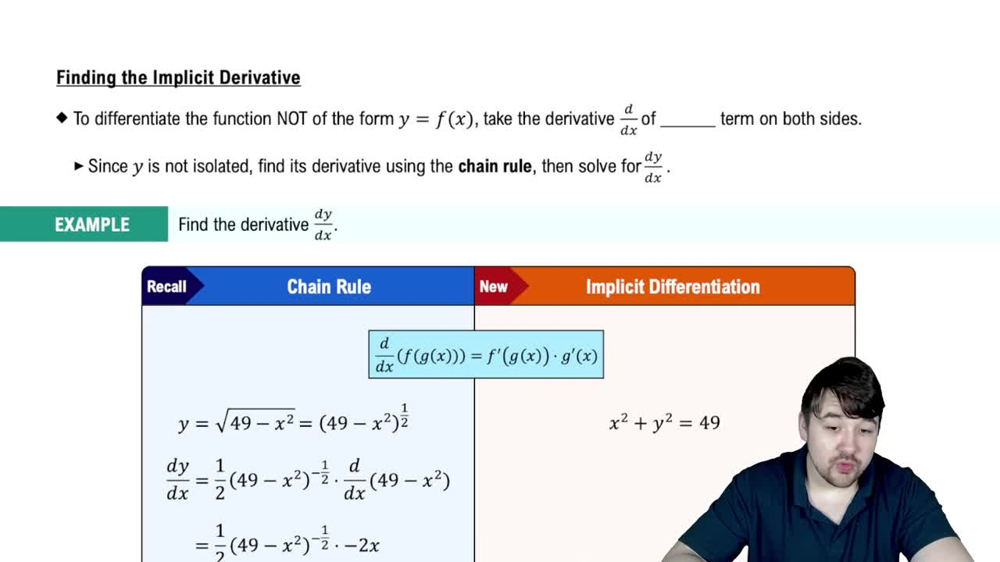
 05:14
05:14