0. Functions
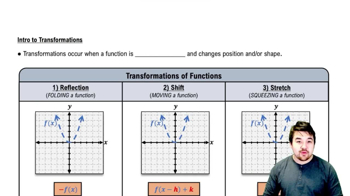
Transformations
Problem 54e
Textbook Question
Describe how each graph is obtained from the graph of 𝔂 = ƒ(x).
e. 𝔂 = ƒ( x ) - 4
3
 Verified step by step guidance
1
Start with the graph of the function \( y = f(x) \). This is your base graph from which transformations will be applied.
The expression \( y = f(x) - 4 \) indicates a vertical shift. Specifically, subtracting 4 from the function means you will shift the entire graph of \( y = f(x) \) downward by 4 units.
To visualize this, take each point \((x, y)\) on the original graph and move it to \((x, y-4)\). This will lower every point on the graph by 4 units.
Ensure that the shape and orientation of the graph remain unchanged; only the position is altered by this vertical shift.
Finally, sketch the new graph to confirm the transformation. The graph should look identical to the original, just shifted down by 4 units on the y-axis.
Recommended similar problem, with video answer:
Verified SolutionThis video solution was recommended by our tutors as helpful for the problem above
Video duration:
5mWas this helpful?

 5:25m
5:25mWatch next
Master Intro to Transformations with a bite sized video explanation from Nick
Start learningRelated Videos
Related Practice