5. Graphical Applications of Derivatives
Curve Sketching
Problem 3.6.50a
Textbook Question
{Use of Tech} Tree growth Let b represent the base diameter of a conifer tree and let h represent the height of the tree, where b is measured in centimeters and h is measured in meters. Assume the height is related to the base diameter by the function h = 5.67+0.70b+0.0067b².
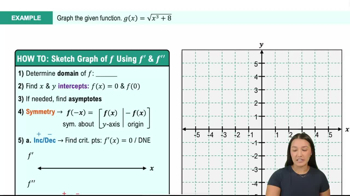
a. Graph the height function.
 Verified step by step guidance
1
Understand the function: The height of the tree, h, is given by the quadratic function h = 5.67 + 0.70b + 0.0067b², where b is the base diameter in centimeters and h is the height in meters.
Identify the type of function: This is a quadratic function in terms of b, which means its graph will be a parabola. Since the coefficient of b² is positive (0.0067), the parabola opens upwards.
Determine the vertex: The vertex of a parabola given by the function h = ax² + bx + c can be found using the formula b = -B/(2A), where A is the coefficient of b² and B is the coefficient of b. In this case, A = 0.0067 and B = 0.70.
Calculate the vertex: Substitute A and B into the vertex formula to find the base diameter b at the vertex. Then, substitute this value of b back into the original function to find the corresponding height h.
Plot the graph: Use the vertex and additional points by choosing various values of b to calculate corresponding h values. Plot these points on a graph with b on the x-axis and h on the y-axis to visualize the height function as a parabola opening upwards.
Verified video answer for a similar problem:This video solution was recommended by our tutors as helpful for the problem above
Video duration:
1mWas this helpful?
Key Concepts
Here are the essential concepts you must grasp in order to answer the question correctly.
Quadratic Functions
The given height function h = 5.67 + 0.70b + 0.0067b² is a quadratic function, which is characterized by its parabolic shape. Quadratic functions can be represented in the standard form ax² + bx + c, where a, b, and c are constants. The coefficient of the b² term (0.0067) indicates that the parabola opens upwards, and its vertex represents the minimum point of the function.
Recommended video:
 6:04
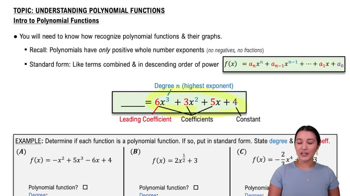
6:04Introduction to Polynomial Functions
Graphing Functions
Graphing a function involves plotting points on a coordinate system to visualize the relationship between the variables. For the height function, the x-axis can represent the base diameter (b), while the y-axis represents the height (h). Understanding how to identify key features such as intercepts, vertex, and the direction of the parabola is essential for accurately graphing the function.
Recommended video:
 5:53
5:53Graph of Sine and Cosine Function
Interpreting Parameters
In the function h = 5.67 + 0.70b + 0.0067b², the parameters have specific meanings: the constant term (5.67) represents the height when the base diameter is zero, the linear term (0.70b) indicates the rate of change of height with respect to diameter, and the quadratic term (0.0067b²) shows how the growth rate changes as the diameter increases. Understanding these parameters helps in interpreting the function's behavior and its implications for tree growth.
Recommended video:
 03:55
03:55The Quotient Rule Example 5
 11:41m
Watch next
Master Summary of Curve Sketching with a bite sized video explanation from Callie
Start learning