2. Intro to Derivatives
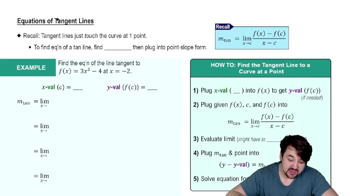
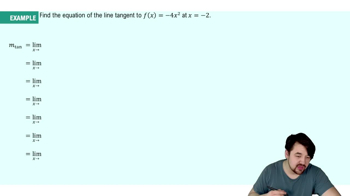
Tangent Lines and Derivatives
Problem 56
Textbook Question
{Use of Tech} Power and energy Power and energy are often used interchangeably, but they are quite different. Energy is what makes matter move or heat up. It is measured in units of joules or Calories, where 1 Cal=4184 J. One hour of walking consumes roughly 10⁶J, or 240 Cal. On the other hand, power is the rate at which energy is used, which is measured in watts, where 1 W=1 J/s. Other useful units of power are kilowatts (1 kW=10³ W) and megawatts (1 MW=10⁶ W). If energy is used at a rate of 1 kW for one hour, the total amount of energy used is 1 kilowatt-hour (1 kWh=3.6×10⁶ J) Suppose the cumulative energy used in a large building over a 24-hr period is given by E(t)=100t+4t²− t³/9 kWh where t=0 corresponds to midnight.
a. Graph the energy function.
 Verified step by step guidance
1
Step 1: Understand the function E(t) = 100t + 4t^2 - \frac{t^3}{9} which represents the cumulative energy used in kilowatt-hours (kWh) over a 24-hour period, where t is the time in hours starting from midnight.
Step 2: Identify the domain of the function. Since the problem specifies a 24-hour period, the domain is 0 \leq t \leq 24.
Step 3: Calculate key points of the function, such as the value of E(t) at t = 0, t = 12, and t = 24, to understand the behavior of the function at the start, middle, and end of the day.
Step 4: Determine the critical points by finding the derivative E'(t) and setting it equal to zero. Solve for t to find where the rate of energy usage changes.
Step 5: Use the calculated points and critical points to sketch the graph of E(t) over the interval [0, 24], noting the shape and any turning points.
Verified video answer for a similar problem:This video solution was recommended by our tutors as helpful for the problem above
Video duration:
9mWas this helpful?
Key Concepts
Here are the essential concepts you must grasp in order to answer the question correctly.
Energy and Power
Energy is the capacity to do work or produce heat, measured in joules or calories. Power, on the other hand, is the rate at which energy is consumed or produced, measured in watts. Understanding the distinction between these two concepts is crucial, as energy quantifies the total work done, while power indicates how quickly that work is performed.
Recommended video:
 04:02
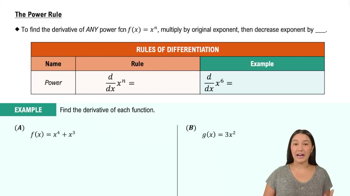
04:02The Power Rule
Graphing Functions
Graphing functions involves plotting points on a coordinate system to visualize the relationship between variables. In this context, the energy function E(t) = 100t + 4t² - t³/9 can be graphed to show how energy consumption changes over time. This visual representation helps in analyzing trends and behaviors of the function.
Recommended video:
 5:53
5:53Graph of Sine and Cosine Function
Cubic Functions
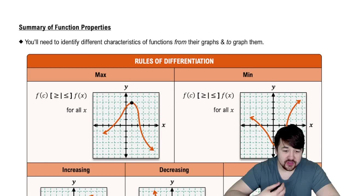
The given energy function is a cubic polynomial, characterized by its highest degree term being cubic (t³). Cubic functions can exhibit various behaviors, including local maxima and minima, and can have inflection points. Understanding the properties of cubic functions is essential for accurately interpreting the graph and determining energy usage patterns over time.
Recommended video:
 06:21
06:21Properties of Functions
 5:13m
5:13mWatch next
Master Slopes of Tangent Lines with a bite sized video explanation from Nick
Start learningRelated Videos
Related Practice