5. Graphical Applications of Derivatives
Curve Sketching
Problem 5d
Textbook Question
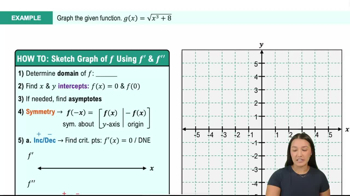
Use the graphs of ƒ' and ƒ" to complete the following steps. <IMAGE>
Plot a possible graph of f.
 Verified step by step guidance
1
Begin by analyzing the graph of ƒ'. The graph of ƒ' provides information about the slope of the original function ƒ. Where ƒ' is positive, ƒ is increasing, and where ƒ' is negative, ƒ is decreasing.
Identify the critical points on the graph of ƒ'. These are the points where ƒ' = 0 or where ƒ' is undefined. At these points, the graph of ƒ may have local maxima, minima, or points of inflection.
Examine the graph of ƒ". The second derivative, ƒ", gives information about the concavity of ƒ. If ƒ" is positive, the graph of ƒ is concave up, and if ƒ" is negative, the graph of ƒ is concave down.
Use the information from ƒ' and ƒ" to sketch the graph of ƒ. Start by plotting the critical points and inflection points, then draw the curve ensuring it increases or decreases according to ƒ' and is concave up or down according to ƒ".
Finally, refine the sketch by ensuring continuity and smoothness, and check that the behavior of the graph of ƒ aligns with the given graphs of ƒ' and ƒ". Adjust the sketch as necessary to accurately reflect the derivative information.
Verified video answer for a similar problem:This video solution was recommended by our tutors as helpful for the problem above
Video duration:
5mWas this helpful?
Key Concepts
Here are the essential concepts you must grasp in order to answer the question correctly.
Derivative and Its Graph
The derivative of a function, denoted as f', represents the rate of change of the function at any given point. The graph of f' indicates where the original function f is increasing or decreasing. If f' is positive, f is increasing; if f' is negative, f is decreasing. Understanding the behavior of f' is crucial for sketching the graph of f.
Recommended video:

 06:15
06:15Graphing The Derivative
Second Derivative and Its Graph
The second derivative, denoted as f'', measures the rate of change of the first derivative. It provides information about the concavity of the function f. If f'' is positive, the graph of f is concave up, indicating a local minimum; if f'' is negative, the graph is concave down, indicating a local maximum. This concept is essential for determining the shape of the graph of f.
Recommended video:
 06:02
06:02The Second Derivative Test: Finding Local Extrema
Critical Points and Inflection Points
Critical points occur where the first derivative f' is zero or undefined, indicating potential local maxima or minima. Inflection points occur where the second derivative f'' changes sign, indicating a change in concavity. Identifying these points is vital for accurately plotting the graph of f, as they highlight significant features of the function's behavior.
Recommended video:
 04:50
04:50Critical Points
 11:41m
Watch next
Master Summary of Curve Sketching with a bite sized video explanation from Callie
Start learning