Table of contents
- 0. Functions7h 52m
- Introduction to Functions16m
- Piecewise Functions10m
- Properties of Functions9m
- Common Functions1h 8m
- Transformations5m
- Combining Functions27m
- Exponent rules32m
- Exponential Functions28m
- Logarithmic Functions24m
- Properties of Logarithms34m
- Exponential & Logarithmic Equations35m
- Introduction to Trigonometric Functions38m
- Graphs of Trigonometric Functions44m
- Trigonometric Identities47m
- Inverse Trigonometric Functions48m
- 1. Limits and Continuity2h 2m
- 2. Intro to Derivatives1h 33m
- 3. Techniques of Differentiation3h 18m
- 4. Applications of Derivatives2h 38m
- 5. Graphical Applications of Derivatives6h 2m
- 6. Derivatives of Inverse, Exponential, & Logarithmic Functions2h 37m
- 7. Antiderivatives & Indefinite Integrals1h 26m
1. Limits and Continuity
Introduction to Limits
Problem 2.2
Textbook Question
Textbook QuestionEvaluate lim x→∞ f(x) and lim x→−∞ f(x) sing the figure. <IMAGE>
 Verified Solution
This video solution was recommended by our tutors as helpful for the problem above
Video duration:
2mPlay a video:
Was this helpful?
Key Concepts
Here are the essential concepts you must grasp in order to answer the question correctly.
Limits at Infinity
Limits at infinity refer to the behavior of a function as the input approaches positive or negative infinity. This concept helps determine the end behavior of functions, indicating whether they approach a specific value, diverge, or oscillate. Understanding limits at infinity is crucial for analyzing functions in calculus, especially when evaluating horizontal asymptotes.
Recommended video:

One-Sided Limits
Horizontal Asymptotes
Horizontal asymptotes are lines that a graph approaches as the input values become very large or very small. They indicate the value that a function approaches as x approaches infinity or negative infinity. Identifying horizontal asymptotes is essential for understanding the long-term behavior of rational functions and can be determined using limits.
Recommended video:

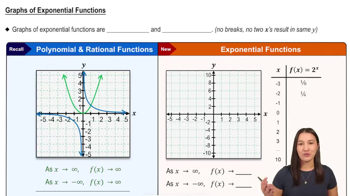
Graphs of Exponential Functions
Graphical Interpretation
Graphical interpretation involves analyzing the visual representation of a function to understand its behavior, including limits and asymptotes. By examining the graph, one can identify trends, such as where the function stabilizes or diverges, which aids in evaluating limits at infinity. This concept emphasizes the importance of visualizing mathematical functions to enhance comprehension.
Recommended video:

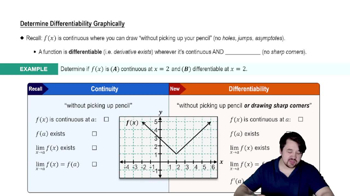
Determining Differentiability Graphically

 6:47m
6:47mWatch next
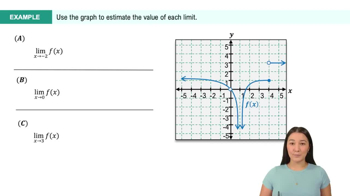
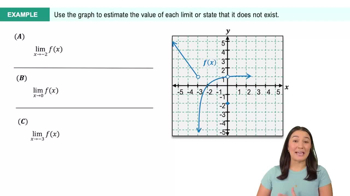
Master Finding Limits Numerically and Graphically with a bite sized video explanation from Callie
Start learning


