1. Limits and Continuity
Introduction to Limits
Problem 1
Textbook Question
Explain the meaning of lim x→−∞ f(x)=10.
 Verified step by step guidance
1
Step 1: Understand the notation: The expression \( \lim_{x \to -\infty} f(x) = 10 \) is read as 'the limit of \( f(x) \) as \( x \) approaches negative infinity is 10.'
Step 2: Conceptualize the behavior: This means that as \( x \) becomes very large in the negative direction (i.e., \( x \) goes to negative infinity), the values of the function \( f(x) \) get closer and closer to 10.
Step 3: Visualize the graph: Imagine the graph of \( f(x) \). As you move left along the x-axis towards negative infinity, the y-values (outputs of \( f(x) \)) approach the horizontal line \( y = 10 \).
Step 4: Consider the horizontal asymptote: The line \( y = 10 \) can be considered a horizontal asymptote of the function \( f(x) \) as \( x \to -\infty \). This means the graph of \( f(x) \) gets closer to this line but may not necessarily touch or cross it.
Step 5: Relate to real-world scenarios: In practical terms, this limit could represent a situation where a quantity stabilizes at a certain value (10 in this case) as time or another variable decreases without bound.
Verified video answer for a similar problem:This video solution was recommended by our tutors as helpful for the problem above
Video duration:
2mWas this helpful?
Key Concepts
Here are the essential concepts you must grasp in order to answer the question correctly.
Limit at Infinity
The limit at infinity describes the behavior of a function as the input approaches infinity or negative infinity. Specifically, lim x→−∞ f(x)=10 indicates that as x decreases without bound, the values of f(x) approach 10. This concept is crucial for understanding how functions behave in extreme cases.
Recommended video:

 05:50
05:50One-Sided Limits
Horizontal Asymptote
A horizontal asymptote is a horizontal line that a graph approaches as x approaches infinity or negative infinity. In this case, the line y=10 serves as a horizontal asymptote for the function f(x) as x approaches negative infinity, indicating that f(x) stabilizes around this value rather than diverging.
Recommended video:
 5:46
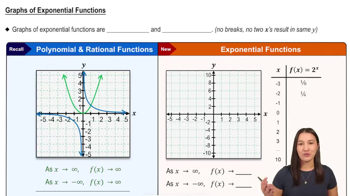
5:46Graphs of Exponential Functions
Function Behavior
Understanding function behavior involves analyzing how a function changes as its input varies. The statement lim x→−∞ f(x)=10 suggests that for very large negative values of x, the function f(x) behaves consistently, converging to the value 10, which is essential for predicting the function's long-term trends.
Recommended video:
5:46Graphs of Exponential Functions
 6:47m
6:47mWatch next
Master Finding Limits Numerically and Graphically with a bite sized video explanation from Callie
Start learning