
Textbook Question
Finding Limits Graphically
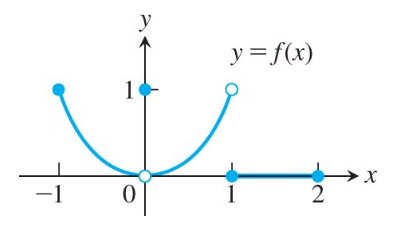
Which of the following statements about the function y = f(x) graphed here are true, and which are false?
c. limx→0− f(x) = 0
300
views
 Verified step by step guidance

 05:50
05:50 05:50
05:50 6:47
6:47Finding Limits Graphically
Which of the following statements about the function y = f(x) graphed here are true, and which are false?
c. limx→0− f(x) = 0
Finding Limits Graphically
Which of the following statements about the function y = f(x) graphed here are true, and which are false?
f. limx→0 f(x) = 0
At what points are the functions in Exercises 13–30 continuous?
y = cos (x) / x
Limits of quotients
Find the limits in Exercises 23–42.
limx→−3 (2 − √(x² − 5)) / (x + 3)
Finding Limits Graphically
Which of the following statements about the function y = f(x) graphed here are true, and which are false?
e. limx→0 f(x) exists
[Technology Exercise] 22. Make a table of values for the function at the points x=1.2, x=11/10, x=101/100, x=1001/1000, x=10001/10000, and x = 1.
a. Find the average rate of change of F(x) over the intervals [1,x] for each x≠1 in your table.
b. Extending the table if necessary, try to determine the rate of change of F(x) at x = 1.