1. Limits and Continuity
Introduction to Limits
Problem 2.2.49
Textbook Question
Sketch the graph of a function with the given properties. You do not need to find a formula for the function.
p(0) = 2,lim x→0 p(x) = 0,lim x→2 p(x) does not exist, p(2)=lim x→2^+ p(x)=1
 Verified step by step guidance
1
Step 1: Start by plotting the point (0, 2) on the graph, as given by p(0) = 2. This indicates that the function passes through this point.
Step 2: Consider the limit as x approaches 0. The limit \( \lim_{x \to 0} p(x) = 0 \) suggests that as x gets very close to 0 from either side, the function value approaches 0. This implies a discontinuity at x = 0 since p(0) = 2.
Step 3: Analyze the behavior around x = 2. The limit \( \lim_{x \to 2} p(x) \) does not exist, indicating a discontinuity at x = 2. However, \( \lim_{x \to 2^+} p(x) = 1 \) tells us that as x approaches 2 from the right, the function value approaches 1.
Step 4: Plot the point (2, 1) on the graph to represent the right-hand limit at x = 2. Since the limit from the left does not exist, the function may have a jump or an asymptote at x = 2.
Step 5: Sketch the graph by connecting the points and considering the limits. The graph should approach 0 as x approaches 0 from either side, jump to 2 at x = 0, and then approach 1 from the right as x approaches 2.
Verified video answer for a similar problem:This video solution was recommended by our tutors as helpful for the problem above
Video duration:
5mWas this helpful?
Key Concepts
Here are the essential concepts you must grasp in order to answer the question correctly.
Limits
Limits describe the behavior of a function as the input approaches a certain value. In this question, the limit as x approaches 0 indicates that the function approaches 0, while the limit as x approaches 2 does not exist, suggesting a discontinuity or a jump in the function's values at that point.
Recommended video:

 05:50
05:50One-Sided Limits
Continuity
A function is continuous at a point if the limit as x approaches that point equals the function's value at that point. In this case, p(0) = 2 while lim x→0 p(x) = 0 indicates that the function is not continuous at x = 0, as the limit does not match the function's value.
Recommended video:
 05:34
05:34Intro to Continuity
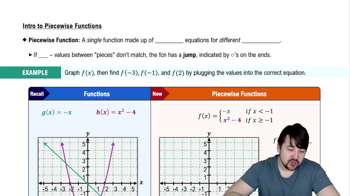
Piecewise Functions
Piecewise functions are defined by different expressions based on the input value. The properties given in the question suggest that the function p(x) may be piecewise, with different behaviors around x = 0 and x = 2, which is essential for sketching the graph accurately.
Recommended video:
 05:36
05:36Piecewise Functions
 6:47m
6:47mWatch next
Master Finding Limits Numerically and Graphically with a bite sized video explanation from Callie
Start learning