5. Graphical Applications of Derivatives
Intro to Extrema
Problem 4.1.16
Textbook Question
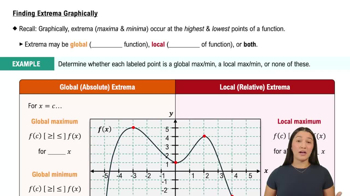
Use the following graphs to identify the points on the interval [a, b] at which local and absolute extreme values occur. <IMAGE>
 Verified step by step guidance
1
Examine the given graphs to identify the interval [a, b] and note the endpoints of this interval, as extreme values can occur at these points.
Look for critical points within the interval where the derivative of the function is zero or undefined, as these points are potential candidates for local extrema.
Evaluate the function values at the critical points identified in the previous step, as well as at the endpoints of the interval [a, b].
Compare the function values obtained from the critical points and the endpoints to determine which are the highest and lowest values, indicating local and absolute extrema.
Conclude by summarizing the points where local and absolute extreme values occur based on your evaluations.
Was this helpful?

 5:58m
5:58mWatch next
Master Finding Extrema Graphically with a bite sized video explanation from Callie
Start learning