1. Limits and Continuity
Introduction to Limits
Problem 45
Textbook Question
Sketch the graph of a function with the given properties. You do not need to find a formula for the function.
f(2) = 1,lim x→2 f(x) = 3
 Verified step by step guidance
1
Start by identifying the key points and behavior of the function. We know that f(2) = 1, which means the function passes through the point (2, 1).
Next, consider the limit condition: \( \lim_{x \to 2} f(x) = 3 \). This indicates that as x approaches 2 from either side, the function approaches the value 3.
Since the limit as x approaches 2 is different from the actual value of the function at x = 2, there is a discontinuity at x = 2. Specifically, this is a removable discontinuity, often represented by a hole in the graph at (2, 3).
To sketch the graph, draw a curve that approaches the y-value of 3 as x approaches 2 from both sides, but make sure the curve actually passes through the point (2, 1).
Finally, indicate the hole at (2, 3) on the graph, which shows the limit behavior, and ensure the graph is consistent with these properties.
Recommended similar problem, with video answer:
Verified SolutionThis video solution was recommended by our tutors as helpful for the problem above
Video duration:
4mWas this helpful?
Key Concepts
Here are the essential concepts you must grasp in order to answer the question correctly.
Function Value
The function value at a specific point, denoted as f(a), represents the output of the function when the input is a. In this case, f(2) = 1 indicates that when x equals 2, the function's output is 1. This is a crucial point to plot on the graph.
Recommended video:
 05:03
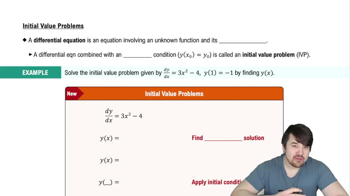
05:03Initial Value Problems
Limit
The limit of a function as x approaches a certain value describes the behavior of the function near that point, regardless of the actual value at that point. Here, lim x→2 f(x) = 3 means that as x gets closer to 2, the function values approach 3, which is important for understanding the function's behavior around x = 2.
Recommended video:
 05:50
05:50One-Sided Limits
Graphical Representation
Graphical representation involves plotting points on a coordinate system to visualize the behavior of a function. In this scenario, the graph should show a point at (2, 1) and indicate that as x approaches 2 from either side, the function approaches the value 3, which may require a hole or a jump in the graph to reflect the limit behavior.
Recommended video:
 05:02
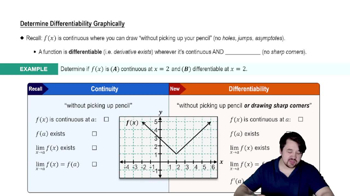
05:02Determining Differentiability Graphically
 6:47m
6:47mWatch next
Master Finding Limits Numerically and Graphically with a bite sized video explanation from Callie
Start learning