5. Graphical Applications of Derivatives
Curve Sketching
Problem 3.6.58a
Textbook Question
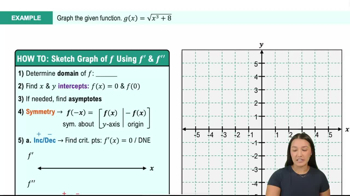
{Use of Tech} Flow from a tank A cylindrical tank is full at time t=0 when a valve in the bottom of the tank is opened. By Torricelli’s law, the volume of water in the tank after t hours is V=100(200−t)², measured in cubic meters.
a. Graph the volume function. What is the volume of water in the tank before the valve is opened?
 Verified step by step guidance
1
To understand the problem, we need to analyze the given volume function V(t) = 100(200−t)². This function represents the volume of water in the tank at any time t, where t is measured in hours.
First, let's determine the initial volume of water in the tank before the valve is opened. This occurs at time t = 0. Substitute t = 0 into the volume function: V(0) = 100(200−0)².
Simplify the expression: V(0) = 100(200)². This will give us the initial volume of water in the tank.
Next, to graph the volume function V(t), consider the function V(t) = 100(200−t)². This is a quadratic function in terms of t, which opens upwards because the coefficient of the squared term is positive.
To graph the function, identify key points such as the vertex and intercepts. The vertex of the parabola occurs at t = 200, which is the point where the volume reaches zero. The y-intercept is the initial volume we calculated earlier. Plot these points and sketch the parabola to visualize how the volume decreases over time.
Verified video answer for a similar problem:This video solution was recommended by our tutors as helpful for the problem above
Video duration:
2mWas this helpful?
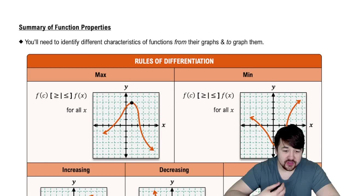
Key Concepts
Here are the essential concepts you must grasp in order to answer the question correctly.
Volume Function
The volume function V(t) = 100(200 - t)² describes how the volume of water in the tank changes over time after the valve is opened. This quadratic function indicates that the volume decreases as time increases, reflecting the outflow of water. Understanding this function is crucial for analyzing the tank's behavior over time.
Recommended video:
 06:21
06:21Properties of Functions
Graphing Quadratic Functions
Graphing quadratic functions involves plotting the function's values on a coordinate plane to visualize its shape, which is typically a parabola. For the given volume function, the graph will open downwards, indicating a maximum volume at t=0 and decreasing as t increases. This visual representation helps in understanding the rate of change of volume over time.
Recommended video:
 5:53
5:53Graph of Sine and Cosine Function
Torricelli’s Law
Torricelli’s Law states that the speed of efflux of a fluid under the force of gravity through an orifice is proportional to the square root of the height of the fluid above the opening. This principle underlies the volume function provided, as it describes how the volume of water decreases over time due to gravitational forces acting on the fluid as it exits the tank.
 11:41m
Watch next
Master Summary of Curve Sketching with a bite sized video explanation from Callie
Start learning