0. Functions
Introduction to Functions
Problem 42b
Textbook Question
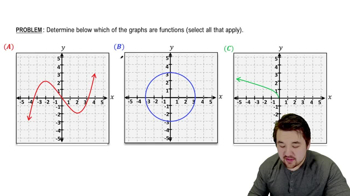
Fish length Assume the length L (in centimeters) of a particular species of fish after t years is modeled by the following graph. <IMAGE>
b. What does the derivative tell you about how this species of fish grows?
 Verified step by step guidance
1
Step 1: Understand the concept of a derivative in this context. The derivative of a function at a given point provides the rate of change of the function's value with respect to its input. In this case, the derivative of the length function L(t) with respect to time t, denoted as L'(t), represents the rate at which the fish's length is changing at any given time.
Step 2: Consider the biological interpretation. The derivative L'(t) tells us how fast the fish is growing at any particular time t. A positive derivative indicates that the fish is growing, while a negative derivative would suggest the fish is shrinking, which is biologically unlikely in this context.
Step 3: Analyze the graph of L(t). Look for key features such as where the graph is increasing, decreasing, or constant. These features will help you understand the behavior of the derivative. For example, if the graph is steep, the derivative is large, indicating rapid growth.
Step 4: Identify any points of interest on the graph, such as where the slope changes. These could be points where the growth rate changes, such as a maximum growth rate or a point where growth slows down.
Step 5: Summarize the growth pattern. Based on the graph and the behavior of the derivative, describe how the fish's growth rate changes over time. This could include periods of rapid growth, slowing growth, or reaching a maximum size.
Recommended similar problem, with video answer:
Verified SolutionThis video solution was recommended by our tutors as helpful for the problem above
Video duration:
3mWas this helpful?

 1:36m
1:36mWatch next
Master Introduction to Calculus Channel with a bite sized video explanation from Callie
Start learning