5. Graphical Applications of Derivatives
Curve Sketching
Problem 4.3.107f
Textbook Question
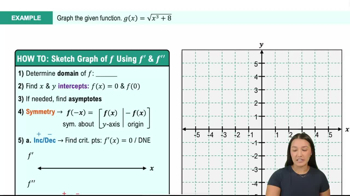
Interpreting the derivative The graph of f' on the interval [-3,2] is shown in the figure. <IMAGE>
f. Sketch one possible graph of f.
 Verified step by step guidance
1
Understand that the graph of f' represents the derivative of the function f, which indicates the slope of the tangent line to the graph of f at any given point.
Identify key features of the graph of f' such as where it is positive, negative, or zero. These features will help determine where the graph of f is increasing, decreasing, or has horizontal tangents.
Note the intervals where f' is positive, which means f is increasing in those intervals. Similarly, note where f' is negative, indicating that f is decreasing.
Look for points where f' is zero, as these correspond to critical points on the graph of f, where the slope of f is zero, possibly indicating local maxima, minima, or points of inflection.
Sketch the graph of f by integrating the behavior of f' over the interval [-3, 2], ensuring that the graph of f reflects the changes in slope indicated by f'.
Verified video answer for a similar problem:This video solution was recommended by our tutors as helpful for the problem above
Video duration:
4mWas this helpful?
Key Concepts
Here are the essential concepts you must grasp in order to answer the question correctly.
Derivative Interpretation
The derivative of a function, denoted as f', represents the rate of change of the function f at any given point. It provides information about the slope of the tangent line to the graph of f. Understanding how to interpret the values of f'—whether they are positive, negative, or zero—helps in determining where the function is increasing, decreasing, or has critical points.
Recommended video:

 05:44
05:44Derivatives
Graph Behavior from Derivative
The graph of the derivative f' reveals important characteristics of the original function f. For instance, where f' is positive, f is increasing; where f' is negative, f is decreasing. Additionally, points where f' crosses the x-axis indicate potential local maxima or minima in f, as these are points where the slope changes from positive to negative or vice versa.
Recommended video:
 06:15
06:15Graphing The Derivative
Sketching Functions from Derivatives
To sketch a possible graph of f based on the graph of f', one must translate the behavior indicated by f' into the shape of f. This involves identifying intervals of increase and decrease, as well as points of inflection and local extrema. By starting from a point on the graph and applying the information from f', one can create a continuous and smooth curve that reflects the changes in slope indicated by the derivative.
Recommended video:
 11:41
11:41Summary of Curve Sketching
 11:41m
Watch next
Master Summary of Curve Sketching with a bite sized video explanation from Callie
Start learning