5. Graphical Applications of Derivatives
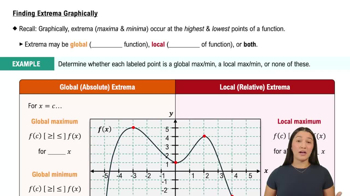
Intro to Extrema
Problem 4.R.2d
Textbook Question
Locating extrema Consider the graph of a function ƒ on the interval [-3, 3]. <IMAGE>
d. Give the approximate coordinates of the zero(s) of f.
 Verified step by step guidance
1
To find the zeros of the function f, we need to identify the points where the graph of the function intersects the x-axis. These points are where the function value is zero, i.e., f(x) = 0.
Examine the graph of the function on the interval [-3, 3]. Look for points where the curve crosses the x-axis. These crossings represent the zeros of the function.
Estimate the x-coordinates of these intersection points by observing the graph. Note that these are approximate values since we are visually inspecting the graph.
If the graph is not clear, consider using a more precise method such as numerical estimation or graphing software to find a more accurate approximation of the zeros.
Once you have identified the approximate x-coordinates, you can express the zeros as ordered pairs (x, 0), where x is the estimated x-coordinate of each zero.
Verified video answer for a similar problem:This video solution was recommended by our tutors as helpful for the problem above
Video duration:
2mWas this helpful?
Key Concepts
Here are the essential concepts you must grasp in order to answer the question correctly.
Extrema
Extrema refer to the maximum and minimum values of a function within a given interval. These points are critical for understanding the behavior of the function, as they indicate where the function reaches its highest or lowest values. Identifying extrema often involves finding the derivative of the function and determining where it is zero or undefined.
Recommended video:
 05:58
05:58Finding Extrema Graphically
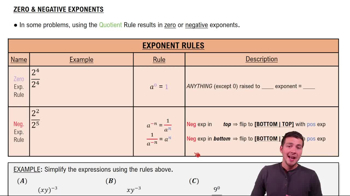
Zeros of a Function
The zeros of a function, also known as roots, are the values of the variable for which the function evaluates to zero. Finding these points is essential for understanding the function's behavior, as they indicate where the graph intersects the x-axis. Techniques for finding zeros include factoring, using the quadratic formula, or applying numerical methods.
Recommended video:
Guided course
 6:37
6:37Zero and Negative Rules
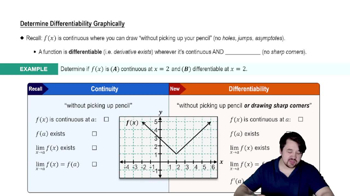
Graphical Analysis
Graphical analysis involves examining the visual representation of a function to identify key features such as intercepts, extrema, and asymptotes. By analyzing the graph, one can gain insights into the function's behavior over a specified interval, making it easier to approximate coordinates of zeros and extrema without relying solely on algebraic methods.
Recommended video:
 05:02
05:02Determining Differentiability Graphically
 5:58m
5:58mWatch next
Master Finding Extrema Graphically with a bite sized video explanation from Callie
Start learning


