1. Limits and Continuity
Introduction to Limits
Problem 2.5.86
Textbook Question
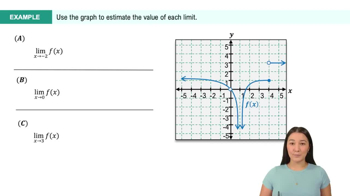
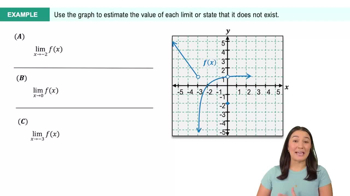
Sketch a possible graph of a function f that satisfies all of the given conditions. Be sure to identify all vertical and horizontal asymptotes.
, , , ,
 Verified step by step guidance
1
Identify the given points on the graph: The function passes through the points (-1, -2), (1, 2), and (0, 0). Plot these points on the coordinate plane.
Determine the horizontal asymptotes: As x approaches infinity, f(x) approaches 1, indicating a horizontal asymptote at y = 1. As x approaches negative infinity, f(x) approaches -1, indicating a horizontal asymptote at y = -1.
Consider the behavior near the given points: Since f(-1) = -2, f(1) = 2, and f(0) = 0, the function must pass through these points smoothly, possibly indicating a polynomial-like behavior between these points.
Sketch the graph considering the asymptotic behavior: As x approaches infinity, the graph should approach y = 1 without crossing it. Similarly, as x approaches negative infinity, the graph should approach y = -1.
Ensure continuity and smoothness: Connect the plotted points with a smooth curve that respects the asymptotic behavior and passes through the given points, ensuring the graph is continuous and differentiable where applicable.
Verified video answer for a similar problem:This video solution was recommended by our tutors as helpful for the problem above
Video duration:
8mWas this helpful?
Key Concepts
Here are the essential concepts you must grasp in order to answer the question correctly.
Asymptotes
Asymptotes are lines that a graph approaches but never touches. Vertical asymptotes occur where a function approaches infinity, typically at points where the function is undefined. Horizontal asymptotes indicate the behavior of a function as x approaches infinity or negative infinity, showing the value the function approaches. Understanding asymptotes is crucial for sketching the overall behavior of a function.
Recommended video:
 5:37
5:37Introduction to Cotangent Graph
Limits
Limits describe the behavior of a function as the input approaches a certain value. They are fundamental in calculus for defining continuity, derivatives, and integrals. In this context, limits at infinity help determine the horizontal asymptotes of the function, indicating the values the function approaches as x becomes very large or very small. Mastery of limits is essential for analyzing function behavior.
Recommended video:
 05:50
05:50One-Sided Limits
Function Values
Function values at specific points provide critical information about the graph of a function. For instance, knowing that f(-1) = -2, f(0) = 0, and f(1) = 2 allows us to plot key points on the graph. These values help in understanding the function's behavior in different intervals and are essential for sketching the graph accurately. They also assist in identifying local maxima, minima, and points of intersection.
Recommended video:
 06:37
06:37Average Value of a Function
 6:47m
6:47mWatch next
Master Finding Limits Numerically and Graphically with a bite sized video explanation from Callie
Start learning