5. Graphical Applications of Derivatives
Curve Sketching
Problem 4.4.26
Textbook Question
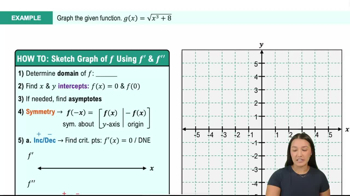
Graphing functions Use the guidelines of this section to make a complete graph of f.
f(x) = x³ - 147x + 286
 Verified step by step guidance
1
Identify the function f(x) = x³ - 147x + 286 and determine its degree and leading coefficient to understand its end behavior.
Find the first derivative f'(x) to locate critical points, which will help in determining where the function increases or decreases.
Set the first derivative equal to zero and solve for x to find the critical points, which will indicate local maxima and minima.
Evaluate the second derivative f''(x) at the critical points to determine the concavity of the function and confirm whether each critical point is a local maximum or minimum.
Plot the critical points, y-intercept, and any inflection points on a coordinate plane, and sketch the graph of the function considering the end behavior and concavity.
Was this helpful?

 11:41m
Watch next
Master Summary of Curve Sketching with a bite sized video explanation from Callie
Start learning