Here are the essential concepts you must grasp in order to answer the question correctly.
Vertical Asymptotes
Vertical asymptotes occur in the graph of a function when the function approaches infinity or negative infinity as the input approaches a certain value. This typically happens at points where the function is undefined, such as division by zero. A function can have multiple vertical asymptotes, depending on its behavior near these undefined points.
Recommended video:
Introduction to Cotangent Graph Example 1
Horizontal Asymptotes
Horizontal asymptotes describe the behavior of a function as the input approaches infinity or negative infinity. They indicate the value that the function approaches but may not necessarily reach. A function can have at most two horizontal asymptotes, one for positive infinity and one for negative infinity, which reflects the end behavior of the function.
Recommended video:
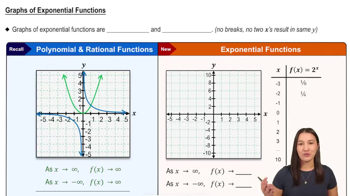
Graphs of Exponential Functions
Function Behavior
Understanding the behavior of a function involves analyzing how it behaves at critical points, including limits, asymptotes, and continuity. This analysis helps in determining the overall shape of the graph and identifying key features such as intercepts and asymptotes. A comprehensive grasp of function behavior is essential for evaluating statements about vertical and horizontal asymptotes.
Recommended video:
Graphs of Exponential Functions
 Verified step by step guidance
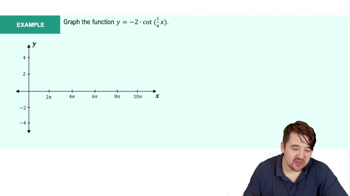
 3:40
3:40