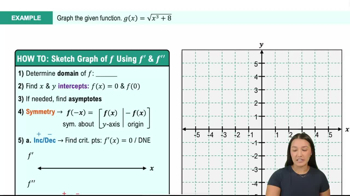
5. Graphical Applications of Derivatives
Curve Sketching
Problem 4.4.66
Textbook Question
{Use of Tech} A pursuit curve A man stands 1 mi east of a crossroads. At noon, a dog starts walking north from the crossroads at 1 mi/hr (see figure). At the same instant, the man starts walking and at all times walks directly toward the dog at s > 1 mi/hr . The path in the xy-plane followed by the man as he pursues the dog is given by the function y = ƒ(x) = s/2 ((x(ˢ⁺¹)/ˢ) /(s+1) - (x(ˢ⁺¹)/ˢ / s-1)) + s/ s² - 1
Select various values of s > 1 and graph this pursuit curve. Comment on the changes in the curve as s increases. <IMAGE>
 Verified step by step guidance
1
Understand the problem: We have a pursuit curve problem where a man is walking towards a dog. The dog moves north at 1 mi/hr from a crossroads, and the man starts 1 mile east of the crossroads, walking at a speed greater than 1 mi/hr directly towards the dog.
Identify the function: The path followed by the man is given by the function y = f(x) = (s/2) * ((x^(s+1)/s) / (s+1) - (x^(s+1)/s) / (s-1)) + s / (s^2 - 1). This function describes the man's path in the xy-plane as he pursues the dog.
Choose values for s: To analyze the pursuit curve, select various values of s greater than 1. For example, you might choose s = 1.5, s = 2, and s = 3. These values will help you observe how the curve changes as the man's speed increases.
Graph the pursuit curve: For each chosen value of s, plot the function y = f(x) on a graph. This will visually represent the path the man takes as he pursues the dog. Use graphing software or a graphing calculator to assist with this step.
Analyze the changes: As you increase the value of s, observe how the pursuit curve changes. Comment on the differences in the path's shape and direction. Typically, as s increases, the man's path becomes more direct and less curved, indicating a faster pursuit towards the dog.
Verified video answer for a similar problem:This video solution was recommended by our tutors as helpful for the problem above
Video duration:
5mWas this helpful?
Key Concepts
Here are the essential concepts you must grasp in order to answer the question correctly.
Pursuit Curves
Pursuit curves describe the path taken by a pursuer (in this case, the man) as they move towards a target (the dog) that is also in motion. The mathematical representation of these curves often involves differential equations that account for the relative speeds and directions of both the pursuer and the target. Understanding pursuit curves is essential for analyzing how the pursuer's path changes based on their speed and the target's movement.
Recommended video:

 11:41
11:41Summary of Curve Sketching
Differential Equations
Differential equations are mathematical equations that relate a function to its derivatives, often used to model dynamic systems. In the context of pursuit curves, they help describe how the position of the pursuer changes over time as they adjust their direction towards the moving target. Solving these equations allows us to predict the trajectory of the pursuer based on their speed and the speed of the target.
Recommended video:
 05:53
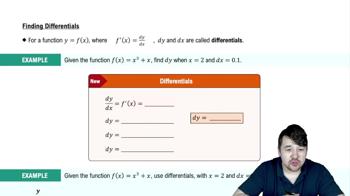
05:53Finding Differentials
Graphing Functions
Graphing functions involves plotting the relationship between variables on a coordinate plane, which helps visualize mathematical concepts. In this scenario, graphing the pursuit curve as a function of the man's speed (s) allows for an analysis of how the curve's shape and behavior change with different speeds. This visual representation is crucial for understanding the dynamics of the pursuit and the impact of varying parameters.
Recommended video:
 5:53
5:53Graph of Sine and Cosine Function
 11:41m
Watch next
Master Summary of Curve Sketching with a bite sized video explanation from Callie
Start learning