1. Limits and Continuity
Finding Limits Algebraically
Problem 95a
Textbook Question
Sketch a graph of y=2^x and carefully draw three secant lines connecting the points P(0, 1) and Q(x,2^x), for x=−3,−2, and −1.
 Verified step by step guidance
1
Step 1: Understand the function y=2^x. This is an exponential function where the base is 2. The graph of y=2^x is a curve that increases rapidly as x increases, and it passes through the point (0, 1) because 2^0 = 1.
Step 2: Plot the point P(0, 1) on the graph. This is a fixed point on the curve y=2^x.
Step 3: Calculate the y-values for the points Q(x, 2^x) when x = -3, -2, and -1. For x = -3, Q is (-3, 2^-3). For x = -2, Q is (-2, 2^-2). For x = -1, Q is (-1, 2^-1).
Step 4: Plot the points Q(-3, 2^-3), Q(-2, 2^-2), and Q(-1, 2^-1) on the graph. These points will be on the curve y=2^x.
Step 5: Draw secant lines connecting the point P(0, 1) to each of the points Q(-3, 2^-3), Q(-2, 2^-2), and Q(-1, 2^-1). These lines represent the average rate of change of the function between P and each Q.
Verified video answer for a similar problem:This video solution was recommended by our tutors as helpful for the problem above
Video duration:
3mWas this helpful?
Key Concepts
Here are the essential concepts you must grasp in order to answer the question correctly.
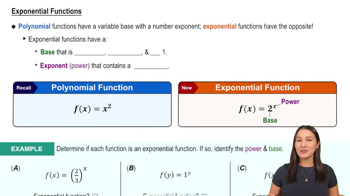
Exponential Functions
Exponential functions are mathematical expressions in the form y = a^x, where 'a' is a positive constant. In this case, y = 2^x represents an exponential function with a base of 2. These functions exhibit rapid growth as x increases and approach zero as x decreases, making them essential for understanding the behavior of the graph.
Recommended video:
 6:13
6:13Exponential Functions
Secant Lines
A secant line is a straight line that connects two points on a curve. In this context, the secant lines connect the fixed point P(0, 1) on the graph of y = 2^x to various points Q(x, 2^x) for specific values of x. The slope of the secant line provides an average rate of change of the function between the two points, which is crucial for analyzing the function's behavior.
Recommended video:
 05:13
05:13Slopes of Tangent Lines
Graphing Techniques
Graphing techniques involve plotting points and understanding the shape and behavior of functions on a coordinate plane. For y = 2^x, it is important to accurately plot points such as P(0, 1) and Q(x, 2^x) for x = -3, -2, and -1. This helps visualize the exponential growth and the relationship between the points and the secant lines drawn between them.
Recommended video:
 06:15
06:15Graphing The Derivative
 5:21m
5:21mWatch next
Master Finding Limits by Direct Substitution with a bite sized video explanation from Callie
Start learningRelated Videos
Related Practice