Textbook Question
For the following position functions, make a table of average velocities similar to those in Exercises 19–20 and make a conjecture about the instantaneous velocity at the indicated time.
c. s(t)=40 sin 2t at t=0
369
views

 Verified step by step guidance
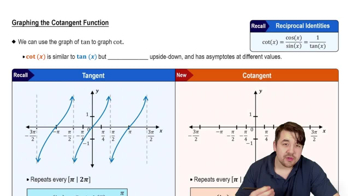
 5:37
5:37 5:53
5:53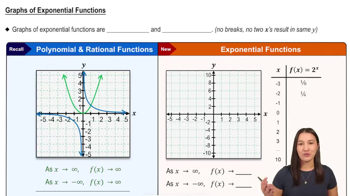 5:46
5:46For the following position functions, make a table of average velocities similar to those in Exercises 19–20 and make a conjecture about the instantaneous velocity at the indicated time.
c. s(t)=40 sin 2t at t=0
Determine whether the following statements are true and give an explanation or counterexample.
c. The graph of a function can have any number of vertical asymptotes but at most two horizontal asymptotes.
Complete the following steps for the given functions.
c. Graph f and all of its asymptotes with a graphing utility. Then sketch a graph of the function by hand, correcting any errors appearing in the computer-generated graph.
The graph of f in the figure has vertical asymptotes at x=1 and x=2. Analyze the following limits. <IMAGE>
lim x→1 f(x)
The graph of ℎ in the figure has vertical asymptotes at x=−2 and x=3. Analyze the following limits. <IMAGE>
lim x→−2 h(x)
Complete the following steps for the given functions.
c. Graph f and all of its asymptotes with a graphing utility. Then sketch a graph of the function by hand, correcting any errors appearing in the computer-generated graph.