
Textbook Question
Finding Limits Graphically
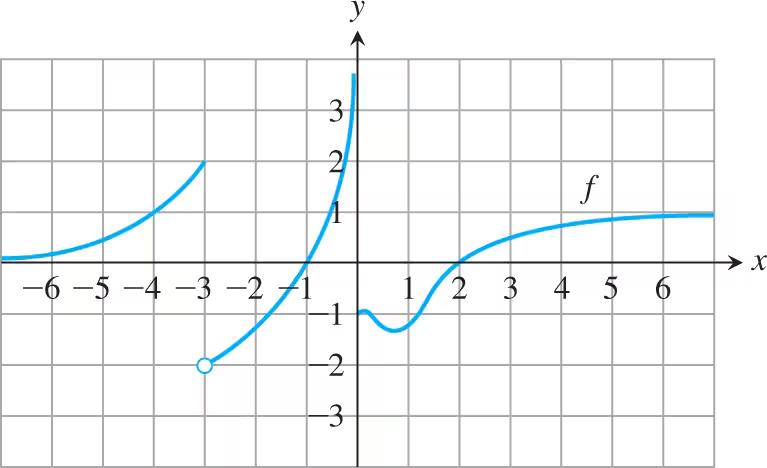
Which of the following statements about the function y = f(x) graphed here are true, and which are false?
<IMAGE>
k. limx→3+ f(x) does not exist.
318
views
 Verified step by step guidance
 03:07
03:07
 3:40
3:40 05:34
05:34Finding Limits Graphically
Which of the following statements about the function y = f(x) graphed here are true, and which are false?
<IMAGE>
k. limx→3+ f(x) does not exist.
Finding Limits Graphically
Which of the following statements about the function y = f(x) graphed here are true, and which are false?
<IMAGE>
g. limx→0+ f(x) = limx→0− f(x)
Which of the following statements about the function y=f(x) graphed here are true, and which are false?
h. f(0)=0
Limits and Continuity
Suppose that ƒ(t) and ƒ(t) are defined for all t and that lim t → t₀ ƒ(t) = ―7 and lim (t → t₀) g (t) = 0 . Find the limit as t → t₀ of the following functions.
f. | ƒ(t) |
Finding Limits Graphically
Which of the following statements about the function y = f(x) graphed here are true, and which are false?
e. limx→1+ f(x) = 1
Limits and Continuity
Suppose that ƒ(t) and ƒ(t) are defined for all t and that lim t → t₀ ƒ(t) = ―7 and lim (t → t₀) g (t) = 0 . Find the limit as t → t₀ of the following functions.
e. cos (g(t))