Welcome back, everyone. Here, we're going to be taking our very first look at limits. The first time that you come across a limit, they may seem a bit intimidating. But in finding a limit, all we're doing is looking at what a function is doing around some given value of x. We can easily do this by either looking at a graph or by creating a table of values.
Now here I'm going to show you both of these ways of finding limits and we'll also walk through some of the notation that you'll encounter when dealing with limits. So let's go ahead and jump in here. First, let's take a look at our limit notation. This is what you'll see anytime you're working with a limit and we can read this as the limit of f of x, our function, as x approaches c, the value for which we're taking the limit. Now looking at this limit here, this is asking us to find the limit of x2, that's our function f of x, as x approaches 2.
lim → x 2 x 2 = 4Remember in finding a limit, we want to look at what our function is doing around that given value of x. A limit is the y value that a function f of x goes to as x gets really close to a given value. Here, we're looking for the y value that our function x2 goes to as x gets really close to 2.
Looking at our graph, as x gets really close to 2 from either side, we want to see what y value our function is going to. First, looking at x from that left side closing in on 2, getting really close to it, I see that my function seems to be approaching a y value of 4. Numerically, plugging values that are getting really close to 2 into my function squaring them, here I get 3.96 and 3.996. Again, these values seem to be approaching a y value of 4. Now let's look at the other side. Plugging values into my function that are closing in on 2 from that other side, like 2.01 and 2.001. Plugging these values into my function, here I get 4.04 and 4.004. From this side, we see that we are indeed approaching a y value of 4.
So our limit of x2 as x approaches 2 is 4. We used two different ways to find this limit: a table and a graph. Now let's work through a couple more examples together here.
lim → x 1 ( x + 4 ) = 5We want to find the limit of x+4 as x approaches 1 by creating a table of values. After looking at values really close to 1 from both sides and plugging them into our function, we can see that we are going to a y value of 5.
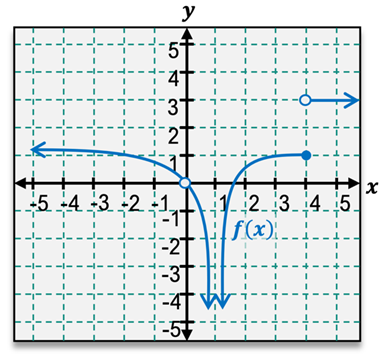
In some cases, we could have just plugged our c value into our function, like here, if we would have just plugged 1 into our function x+4, we would have gotten 5, which is exactly what our limit is. However, this is not always going to be true. We cannot always rely on plugging in that function value because our limit will not always be equal to the function value, so we can't just plug c in from the beginning. So with that in mind, let's look at this final example here. We want to find the limit of f of x as x approaches 3 using this graph.
lim → x 3 f ( x ) = 1Looking at the graph, as x gets really close to 3 from both sides, we see that our function is going to a y value of 1. If we had just plugged 3 into our function or just looked at that function value on our graph, we would have gotten 4, which is a completely wrong answer. That is not what our limit is because our limit is 1. It's very clear that our limit will indeed not always be equal to our function value. We need to look at x getting really, really close to c, not x actually being equal to c because we never know if our function value is going to be something entirely different like we saw on our graph here or if it even exists at that point. It doesn't matter because we only care what's going on around it. So with this in mind, let's work through some more practice together.
Thanks for watching, and let me know if you have questions.


