Population Demography exam Flashcards
Population Demography exam
You can tap to flip the card.
Demography
The statistical study of population characteristics, including size, structure, and distribution.What factors influence population characteristics in demography?
Birth rates, death rates, and migration.Life Table
A comprehensive statistical table that shows a population's survivorship, mortality, and reproductive rates of a cohort.Cohort
A group of same species individuals born into a population around the same time.Why do life tables often only include data on females?
Because only females produce offspring, having a greater impact on population dynamics.Survivorship Curve
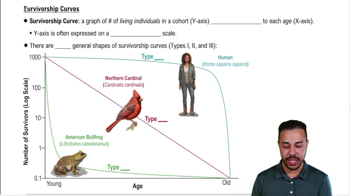
A graphical representation of a life table, showing the number of living individuals in a cohort surviving to each age group.Type 1 Survivorship Curve
Characterized by low early mortality and high mortality later in life; example: humans.Type 2 Survivorship Curve
Characterized by a constant mortality rate throughout the species' lifetime; example: northern cardinal.Type 3 Survivorship Curve
Characterized by high early mortality and low mortality later in life; example: American bullfrog.What is the significance of a logarithmic scale in survivorship curves?
It allows for a wide range of values to be plotted on the same graph.What does a life table's age interval represent?
The specific age range being analyzed for survivorship and mortality rates.Fecundity
The capacity for an organism to reproduce, often measured as the average number of female offspring per female.What does a survivorship curve's y-axis represent?
The number of living individuals in a cohort.What does a survivorship curve's x-axis represent?
The age groups of the cohort.Mortality Rate
The overall death rate between age intervals in a life table.Survivorship
The proportion of organisms still alive at the start of an age interval.What is the purpose of a life table?
To summarize demographic data for cohorts, focusing on survivorship, mortality, and reproductive rates.How is the mortality rate calculated in a life table?
By dividing the number of deaths by the initial number of organisms in the age interval.What is the main focus of demography?
Analyzing population dynamics and ecological interactions.What does a type 1 survivorship curve indicate about a species?
Most individuals survive to adulthood, with high mortality rates later in life.What does a type 2 survivorship curve indicate about a species?
Mortality rates are constant throughout the species' lifetime.What does a type 3 survivorship curve indicate about a species?
High mortality rates early in life, with few individuals reaching adulthood.Why is understanding survivorship curves important?
They help in analyzing population dynamics and predicting future population trends.What is the relationship between life tables and survivorship curves?
Survivorship curves are graphical representations of the data in life tables.What is the significance of the age interval in a life table?
It helps in analyzing the survivorship and mortality rates at different stages of life.How is survivorship calculated in a life table?
By dividing the number of organisms alive at the start of an age interval by the initial number of organisms.What is the importance of studying demography?
It provides insights into population trends and helps in making informed decisions for conservation and management.What does the term 'population dynamics' refer to?
The changes in population size, structure, and distribution over time.
 00:43
00:43