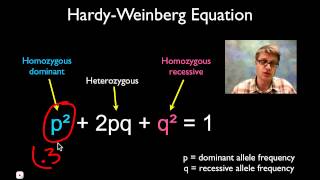
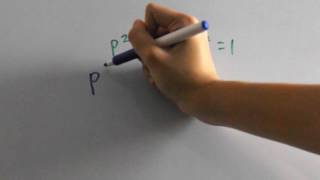
Hi. In this video, we're going to talk about the Harvey Weinberg principle, which is a way of modeling allele and genotype frequencies in a particular population. But, this model actually rests on some pretty stringent assumptions that are very hard to meet in real life, in the wild. So, what are these five assumptions? Well, the population you're looking at must have random mating, meaning that individuals choose mates randomly. Now we already know that sexual selection is very prevalent in nature, meaning this is a tough condition to meet. So, you also cannot have any natural selection because all the individuals in the population have to be able to contribute to the gene pool equally for this model to hold. Now again, it's very uncommon that there's no natural selection going on in the wild. So another condition that is difficult to meet. You also cannot have any genetic drift and this basically means that the alleles that get distributed to the offspring have to be distributed according to the probability rules that we talked about when we talked about Mendelian genetics. So this is much easier to meet in a this is a much easier condition to meet in a large population where random errors tend to be smoothed out. We'll actually talk about genetic drift in a later video, but basically genetic drift is when alleles are distributed to offspring and they don't follow those probability rules that we talked about before. It's kinda like alleles are getting lucky and being distributed at higher probabilities than the mathematical models would have predicted. Again, it's an idea we're we'll revisit later, but the main point for Hardy Weinberg is that alleles must be being distributed according to the probability rules we discussed. Now you also cannot have gene flow, meaning no new alleles are added to the population and none are lost from it. So, basically, the alleles are set and you don't get any new ones, you don't lose any, just have the alleles you have. And you can't have mutation either, and that's because mutation would alter alleles. So again, it's kind of following from that no gene flow idea, you can't have any changes in your alleles, they have to stay static. So taking a look at this graph here, this graph visually displays the ideas in So, q squared, So, q squared, that variable actually represents the homozygous recessive individuals. So homozygous homozygous homozygous recessive. 2 PQ represents the heterozygotes in the population. And P squared, as you may have guessed, represents the homozygous dominant individuals. So, taking a look at this graph, if we draw a line right down the center, meaning that we have a population where the frequencies of each individual allele, that's what's displayed down here at the bottom, the frequencies of each individual allele. So if the frequencies of our 2 alleles are dead even, then our genotype frequencies will be as such. Our heterozygotes fall right about 50% mark or 0.5. So half of our population is going to be heterozygous. Our homozygotes, as you can see, they're both going to be at the same percentage because they actually, those curves cross each other right there at the halfway mark that we selected and that is going to be about 0.25 or a 25% frequency. So in this population, we had 50% heterozygotes, 25% homozygous recessive, and 25% homozygous dominant making, giving us a 100% full population. Now let's actually take a look at how to work with these equations with some actual numbers. So before we jump into that, just wanna point out that we will actually be using 2 equations that look at slightly different things. This first equation here, that looks at genotype frequencies which is what we were talking about in that graph looking at the percentage of the population that is homozygous recessive, heterozygous, or homozygous dominant. This second equation just looks at allele frequencies. So what percentage of the population has the capital A allele? What percentage has the lower case a allele? So, how do we actually use these equations? Well, let's say that in a given population we know that there is a particular condition that results from having 2 copies of a recessive allele. Something we we should be familiar with by now. So that means that that percentage of the population, let's call it 16%. So let's say 16% of our population of pop has recessive condition. That means that q squared equals 0.16 because q squared, that's going to be the members of the population who are homozygous recessive, meaning the members of the population who are going to display this recessive condition. So if 16% of the population has that recessive condition, that means q squared equals 0.16. Now, how do we figure out how many people in our population are heterozygotes? We know, we can say with confidence that 84% is unaffected. But let's say we want to assess the risk for the future generations. So we want to know how many people are heterozygous, how many people are carriers for this particular trait. Well, how do we do that? We actually have to turn and use the second equation, that equation for allele frequencies. So if q squared is point 16, we can take the square root of 0.16, which is 0.4. That means that in our population 40% of people have the a allele. So by what that equation shows us that means that 60% have the capital A allele because the, value for q and the value for p must equal 1. So if q is 0.4, then p must be 0.6 or 60%. Now, how do we determine how many people are heterozygotes? Well, we know q, we know p, and we know that heterozygotes are 2pq. So we do 2 times the value for p, which is 0.6, or 0.6, times the value for q, which is 0.4 and that means that there are 0.4, that equals 0.48 so, that means that 48% of the population are heterozygotes. And just to be complete you could also figure out how many are homozygotes. Let me take myself out of the image here so I have a little more room to write. So if p equals 0.6 then p squared equals 0.36 and that means that 36% of our population is homozygous dominant. So, these equations are not extremely complicated to use. However, they offer a powerful tool for us to determine the genotypes and allele frequencies in a population, at least one that meets those five conditions laid out by Hardy Weinberg Hardy and Weinberg. So that is how you use the Hardy Weinberg equations, that's what they represent. And that's all I have for this video. So I'll see you guys next time.

 06:29
06:29