50. Population Ecology
Introduction to Population Ecology
Problem 1a
Textbook Question
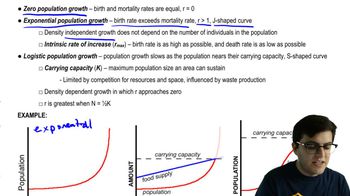
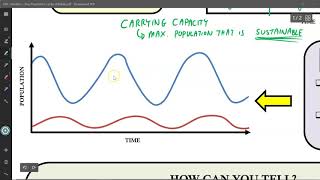
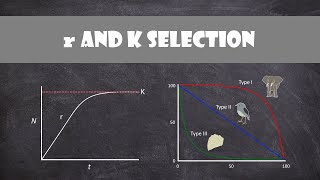
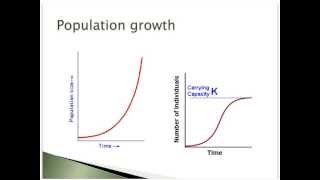
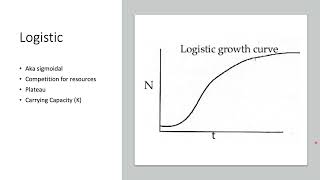
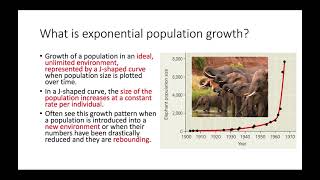
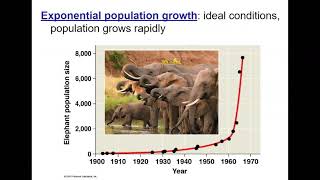
Textbook QuestionUse this graph of the idealized exponential and logistic growth curves to complete the following. a. Label the axes and curves on the graph. b. Give the formula that describes the blue curve. c. What does the dotted line represent? d. For each curve, indicate and explain where population growth is the most rapid. e. Which of these curves best represents global human population growth?

 Verified Solution
This video solution was recommended by our tutors as helpful for the problem above
Video duration:
2m896
views
Was this helpful?
Related Videos
Related Practice
 05:45
05:45


Showing 1 of 66 videos