50. Population Ecology
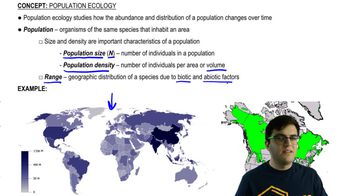
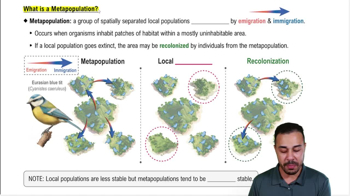
Introduction to Population Ecology
Problem 2a
Textbook Question
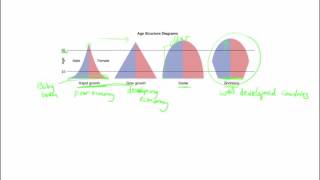
Textbook QuestionThe graph below shows the demographic transition for a hypothetical country. Many developed countries that have achieved a stable population size have undergone a transition similar to this. Answer the following questions concerning this graph. a. What does the blue line represent? The red line? b. This diagram has been divided into four sections. Describe what is happening in each section. c. In which section(s) is the population size stable? d. In which section is the population growth rate the highest?

 Verified Solution
This video solution was recommended by our tutors as helpful for the problem above
Video duration:
1m714
views
Was this helpful?
Related Videos
Related Practice
 05:45
05:45


Showing 1 of 66 videos