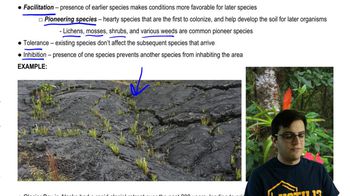
51. Community Ecology
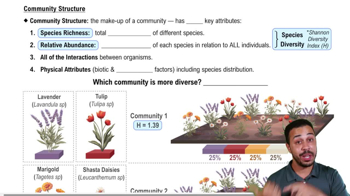
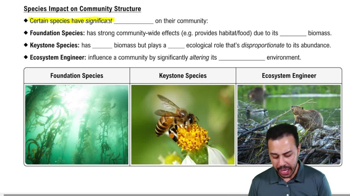
Community Structure
Problem 5`
Textbook Question
According to the generalized species-area curve, when habitat is reduced to 50% of its original size, approximately
a. 10%
b. 25%
c. 50%
d. 90%
 Verified step by step guidance
1
Understand the species-area relationship: The species-area curve is a mathematical model that describes how the number of species (biodiversity) changes with the size of a habitat. It is often expressed as S = cA^z, where S is the number of species, A is the area, c is a constant, and z is the exponent that determines the curve's shape.
Recognize the key principle: When habitat area is reduced, the number of species typically decreases, but the relationship is not linear. The exponent z (usually between 0.2 and 0.4 for most ecosystems) determines how sensitive species richness is to changes in area.
Apply the concept to the problem: If the habitat is reduced to 50% of its original size, the species-area curve can be used to estimate the percentage of species lost. The formula S = cA^z implies that the new species richness (S') is proportional to the reduced area (A') raised to the power of z.
Set up the calculation: To estimate the percentage of species lost, calculate the ratio of the new species richness (S') to the original species richness (S). This ratio is given by (A'/A)^z, where A' is 50% of the original area (A). The percentage of species lost is then 100% - [(A'/A)^z * 100%].
Interpret the options: Based on typical values of z (e.g., 0.2–0.4), a 50% reduction in habitat area generally results in a species loss of approximately 10–25%. This aligns with one of the provided answer choices.
Verified video answer for a similar problem:This video solution was recommended by our tutors as helpful for the problem above
Video duration:
2mWas this helpful?
Key Concepts
Here are the essential concepts you must grasp in order to answer the question correctly.
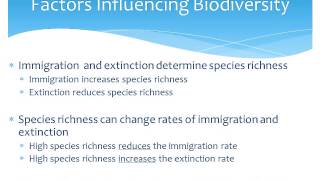
Species-Area Relationship
The species-area relationship is a fundamental ecological principle that describes how the number of species increases with the area of habitat available. This relationship is often represented graphically, showing that larger areas tend to support more species due to greater habitat diversity and resources. Understanding this concept is crucial for predicting biodiversity loss when habitats are fragmented or reduced.
Recommended video:
Guided course

 02:55
02:55Biogeography and Species-Area Curve
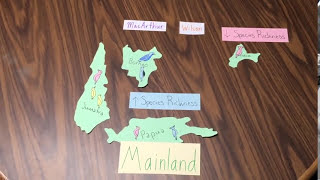
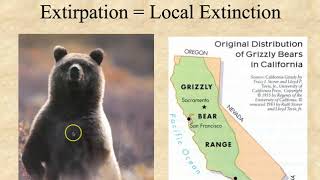
Habitat Fragmentation
Habitat fragmentation refers to the process where large, continuous habitats are divided into smaller, isolated patches, often due to human activities like urban development or agriculture. This fragmentation can lead to a decline in species populations and biodiversity, as smaller habitats may not support viable populations. Recognizing the impact of habitat size on species survival is essential for conservation efforts.
Recommended video:
Guided course
 03:23
03:23Habitat Destruction and Degradation
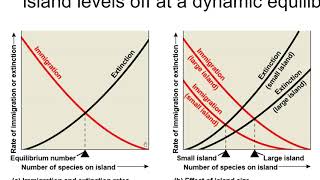
Generalized Species-Area Curve
The generalized species-area curve is a model that illustrates the expected relationship between habitat area and species richness. It typically shows that as habitat area decreases, the number of species declines, often following a predictable pattern. This curve helps ecologists estimate potential species loss in response to habitat reduction, providing insights into conservation strategies.
Recommended video:
Guided course
02:55Biogeography and Species-Area Curve

Related Videos
Related Practice