7. Energy and Metabolism
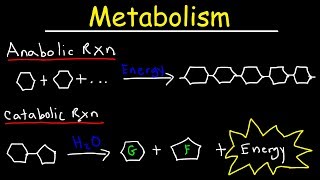
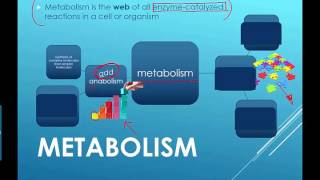
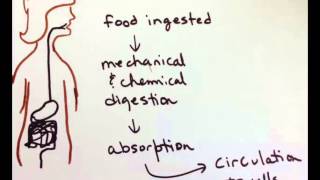
Introduction to Metabolism
Problem 17`
Textbook Question
SCIENTIFIC THINKING Several studies have found a correlation between the activity levels of brown fat tissue in research participants following exposure to cold and their percentage of body fat. Devise a graph that would present the results from such a study, labeling the axes and drawing a line to show whether the results show a positive or negative correlation between the variables. Propose two hypotheses that could explain these results.
 Verified step by step guidance
1
Step 1: Understand the variables involved in the study. The two variables are (1) activity levels of brown fat tissue following exposure to cold and (2) percentage of body fat in research participants. A correlation indicates how these two variables are related, either positively or negatively.
Step 2: Devise a graph to represent the correlation. Label the x-axis as 'Activity Levels of Brown Fat Tissue (following cold exposure)' and the y-axis as 'Percentage of Body Fat'. If the correlation is positive, the line on the graph will slope upward; if negative, the line will slope downward.
Step 3: Determine the type of correlation based on the study results. If the study found that higher activity levels of brown fat tissue are associated with lower percentages of body fat, the correlation is negative. Conversely, if higher activity levels are associated with higher percentages of body fat, the correlation is positive.
Step 4: Propose Hypothesis 1: Brown fat tissue activity increases energy expenditure in response to cold exposure, leading to a reduction in body fat percentage over time.
Step 5: Propose Hypothesis 2: Individuals with lower body fat percentages may have more active brown fat tissue, which is more responsive to cold exposure as part of thermoregulation.
Verified video answer for a similar problem:This video solution was recommended by our tutors as helpful for the problem above
Video duration:
1mWas this helpful?
Key Concepts
Here are the essential concepts you must grasp in order to answer the question correctly.
Correlation
Correlation refers to a statistical relationship between two variables, indicating how one may change in relation to the other. In this context, it examines the relationship between brown fat activity and body fat percentage. A positive correlation means that as one variable increases, the other does as well, while a negative correlation indicates that as one variable increases, the other decreases.
Recommended video:
Guided course

 05:01
05:01Introduction to the Cytoskeleton
Graphing Data
Graphing data is a visual representation of information that helps in understanding relationships between variables. In this case, the x-axis could represent the activity levels of brown fat, while the y-axis could represent body fat percentage. A line of best fit can be drawn to illustrate the correlation, helping to visualize whether the relationship is positive or negative.
Recommended video:
Guided course
 03:26
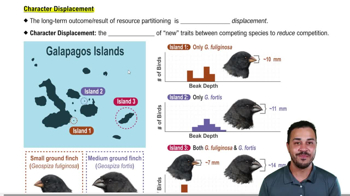
03:26Character Displacement
Hypothesis Formation
Hypothesis formation involves proposing explanations for observed phenomena based on existing knowledge. In this scenario, two hypotheses could be: 1) Increased brown fat activity leads to higher energy expenditure, resulting in lower body fat percentage, or 2) Individuals with lower body fat may have more active brown fat due to metabolic adaptations. These hypotheses can guide further research and experimentation.
Recommended video:
Guided course
 08:22
08:22Predictions, Hypotheses, & Theories
 2:17m
2:17mWatch next
Master Introduction to Metabolism with a bite sized video explanation from Jason
Start learningRelated Videos
Related Practice