Table of contents
- 1. Introduction to Biology2h 40m
- 2. Chemistry3h 40m
- 3. Water1h 26m
- 4. Biomolecules2h 23m
- 5. Cell Components2h 26m
- 6. The Membrane2h 31m
- 7. Energy and Metabolism2h 0m
- 8. Respiration2h 40m
- 9. Photosynthesis2h 49m
- 10. Cell Signaling59m
- 11. Cell Division2h 47m
- 12. Meiosis2h 0m
- 13. Mendelian Genetics4h 41m
- Introduction to Mendel's Experiments7m
- Genotype vs. Phenotype17m
- Punnett Squares13m
- Mendel's Experiments26m
- Mendel's Laws18m
- Monohybrid Crosses16m
- Test Crosses14m
- Dihybrid Crosses20m
- Punnett Square Probability26m
- Incomplete Dominance vs. Codominance20m
- Epistasis7m
- Non-Mendelian Genetics12m
- Pedigrees6m
- Autosomal Inheritance21m
- Sex-Linked Inheritance43m
- X-Inactivation9m
- 14. DNA Synthesis2h 27m
- 15. Gene Expression3h 20m
- 16. Regulation of Expression3h 31m
- Introduction to Regulation of Gene Expression13m
- Prokaryotic Gene Regulation via Operons27m
- The Lac Operon21m
- Glucose's Impact on Lac Operon25m
- The Trp Operon20m
- Review of the Lac Operon & Trp Operon11m
- Introduction to Eukaryotic Gene Regulation9m
- Eukaryotic Chromatin Modifications16m
- Eukaryotic Transcriptional Control22m
- Eukaryotic Post-Transcriptional Regulation28m
- Eukaryotic Post-Translational Regulation13m
- 17. Viruses37m
- 18. Biotechnology2h 58m
- 19. Genomics17m
- 20. Development1h 5m
- 21. Evolution3h 1m
- 22. Evolution of Populations3h 52m
- 23. Speciation1h 37m
- 24. History of Life on Earth23m
- 25. Phylogeny40m
- 26. Prokaryotes1h 5m
- 27. Protists1h 6m
- 28. Plants1h 22m
- 29. Fungi36m
- 30. Overview of Animals34m
- 31. Invertebrates1h 2m
- 32. Vertebrates50m
- 33. Plant Anatomy1h 3m
- 34. Vascular Plant Transport2m
- 35. Soil37m
- 36. Plant Reproduction47m
- 37. Plant Sensation and Response1h 9m
- 38. Animal Form and Function1h 19m
- 39. Digestive System10m
- 40. Circulatory System1h 57m
- 41. Immune System1h 12m
- 42. Osmoregulation and Excretion50m
- 43. Endocrine System4m
- 44. Animal Reproduction2m
- 45. Nervous System55m
- 46. Sensory Systems46m
- 47. Muscle Systems23m
- 48. Ecology3h 11m
- Introduction to Ecology20m
- Biogeography14m
- Earth's Climate Patterns50m
- Introduction to Terrestrial Biomes10m
- Terrestrial Biomes: Near Equator13m
- Terrestrial Biomes: Temperate Regions10m
- Terrestrial Biomes: Northern Regions15m
- Introduction to Aquatic Biomes27m
- Freshwater Aquatic Biomes14m
- Marine Aquatic Biomes13m
- 49. Animal Behavior28m
- 50. Population Ecology3h 41m
- Introduction to Population Ecology28m
- Population Sampling Methods23m
- Life History12m
- Population Demography17m
- Factors Limiting Population Growth14m
- Introduction to Population Growth Models22m
- Linear Population Growth6m
- Exponential Population Growth29m
- Logistic Population Growth32m
- r/K Selection10m
- The Human Population22m
- 51. Community Ecology2h 46m
- Introduction to Community Ecology2m
- Introduction to Community Interactions9m
- Community Interactions: Competition (-/-)38m
- Community Interactions: Exploitation (+/-)23m
- Community Interactions: Mutualism (+/+) & Commensalism (+/0)9m
- Community Structure35m
- Community Dynamics26m
- Geographic Impact on Communities21m
- 52. Ecosystems28m
- 53. Conservation Biology24m
22. Evolution of Populations
Natural Selection
Multiple Choice
Multiple ChoiceThe graph below shows the birthweights and infant mortality rate as recorded by researchers in London between 1935 and 1946. The bars represent the number of births recorded in 0.5-pound increments. The orange dots represent the mortality rate for each birthweight and are shown on a logarithmic scale. What type of selection does this graph suggest directly affects human birth weight?
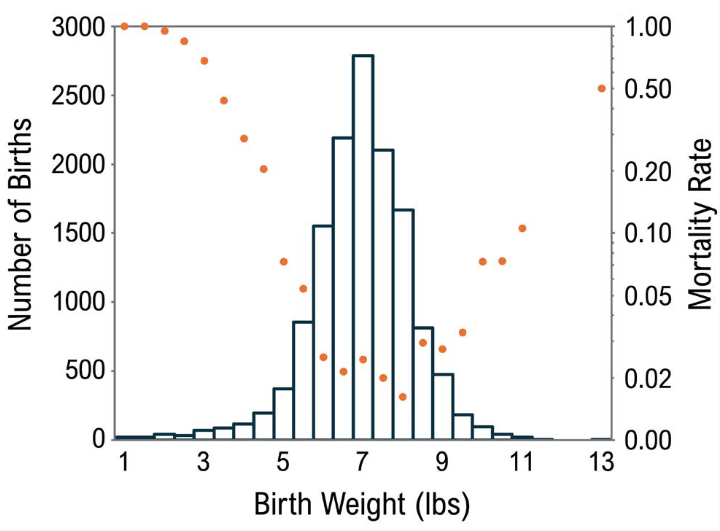
Graph adapted from: M.N. Karn and L.S. Penrose, Birth Weight and Gestation Time in Relation to Maternal Age, Parity, and Infant Survival. Annals of Eugenics, January 1951, Vol. 16 No. 1., Page 147-164.
A
Diversifying selection.
B
Stabilizing selection.
C
Artificial selection.
D
Directional selection.
66
views
Related Videos
Related Practice

 04:43
04:43

Showing 1 of 6 videos