51. Community Ecology
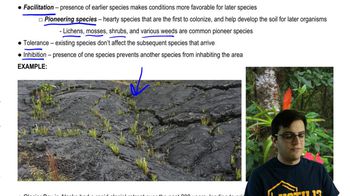
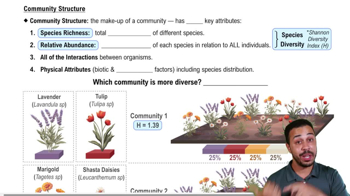
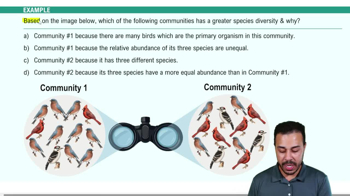
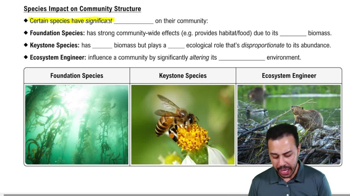
Community Structure
Problem 8`
Textbook Question
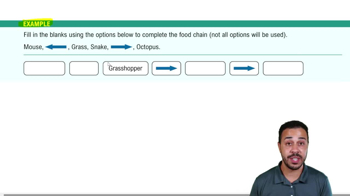
Draw a vertical food chain (part of a food web) showing that sea urchins eat kelp and that sea otters eat sea urchins.
Use this model to (1) show or explain how a trophic cascade works; and (2) offer an explanation for why otters are considered a keystone species.
 Verified step by step guidance
1
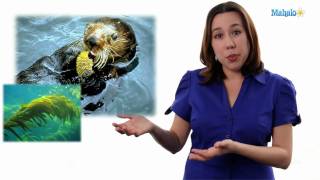
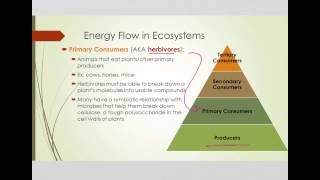
Start by drawing a vertical food chain with kelp at the bottom, followed by sea urchins, and then sea otters at the top. This represents the flow of energy from producers to consumers.
Explain the concept of a trophic cascade: When sea otters are present, they eat sea urchins, which reduces the sea urchin population. This allows kelp forests to thrive because there are fewer sea urchins to eat the kelp.
Discuss the impact of removing sea otters: Without sea otters, sea urchin populations can increase unchecked, leading to overgrazing of kelp forests and a decline in kelp abundance.
Define a keystone species: A keystone species is one that has a disproportionately large impact on its environment relative to its abundance. Sea otters are considered a keystone species because their presence or absence dramatically affects the structure of the ecosystem.
Illustrate the importance of sea otters: By controlling sea urchin populations, sea otters help maintain the balance of the ecosystem, supporting biodiversity and the health of kelp forests, which serve as habitats for many marine organisms.
Verified video answer for a similar problem:This video solution was recommended by our tutors as helpful for the problem above
Video duration:
3mWas this helpful?
Key Concepts
Here are the essential concepts you must grasp in order to answer the question correctly.
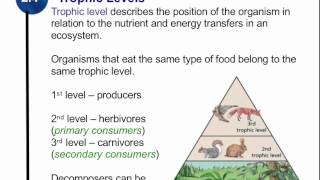
Trophic Cascade
A trophic cascade is an ecological phenomenon triggered by the addition or removal of top predators, leading to cascading effects on lower trophic levels. In the given food chain, the presence of sea otters, which prey on sea urchins, helps control the sea urchin population. This, in turn, allows kelp forests to thrive, demonstrating how changes at the top of the food chain can significantly impact the entire ecosystem.
Recommended video:
Guided course
 02:35
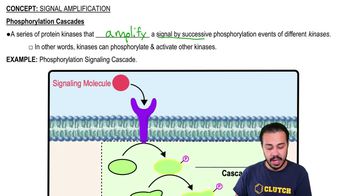
02:35Phosphorylation Cascades
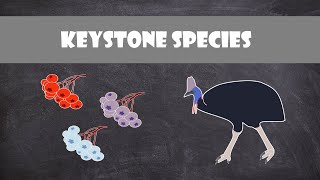
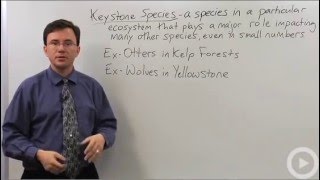
Keystone Species
A keystone species is one that has a disproportionately large impact on its environment relative to its abundance. Sea otters are considered a keystone species because their predation on sea urchins prevents overgrazing of kelp forests. Without otters, sea urchin populations would explode, leading to the destruction of kelp habitats and a loss of biodiversity, highlighting the critical role otters play in maintaining ecological balance.
Recommended video:
 03:24
03:24Biological Species Concept
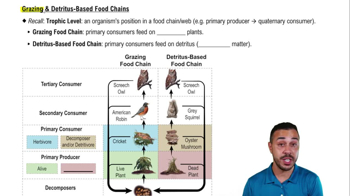
Food Chain and Food Web
A food chain is a linear sequence of organisms where each is eaten by the next member in the chain. In contrast, a food web is a complex network of interconnected food chains. The image illustrates a food web, showing multiple predator-prey relationships, such as owls preying on rats and foxes preying on beetles. Understanding these interactions helps explain the dynamics of energy flow and nutrient cycling within an ecosystem.
Recommended video:
Guided course
 03:29
03:29Grazing & Detritus-Based Food Chains

Related Videos
Related Practice