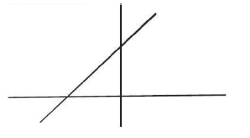
So now that we've introduced the Lineweaver Burk equation in our last lesson video, in this video, we're going to introduce the Lineweaver Burk plot, which is really just another way to plot enzyme kinetics data. And so recall from our previous lesson videos, we had an enzyme kinetics plot in many of our videos and in the enzyme kinetics plot, we had the initial reaction velocity on the y-axis and the substrate concentration on the x-axis, and we know that Michaelis-Menten enzymes will form this rectangular hyperbola shape on this curve, which is definitely more complicated of a shape than a straight line. And so, instead of getting a rectangular hyperbola shape, the Lineweaver Burk plot, of course, is going to get a line, and so that's somewhat of an advantage of Lineweaver Burk plots that we're able to interpret the data just using a very simple straightforward line. And from this straight line that we get on a Lineweaver Burk plot, we're able to obtain the values for both the theoretical maximum velocity, , as well as the Michaelis constant . And again, these are both able to be determined from the straight line of a Lineweaver Burk plot. Now, it's also important to note that sometimes Lineweaver Burk plots are also referred to as double reciprocal plots and the reason that they are referred to as double reciprocal plots is because notice that on the plot, there's going to be a bunch of reciprocals. And so notice that instead of having the initial reaction velocity on the y-axis, on a Lineweaver Burk plot, notice that on the y-axis what we have is the reciprocal of the initial reaction velocity. And so that's what we're saying here is that we plot the reciprocals of both the initial reaction velocity as , here, but we also plot substrate concentration. So instead of plotting the substrate concentration, a Lineweaver Burk plot plots the reciprocal of the substrate concentration or one over the substrate concentration on the x-axis. And so, when, scientists do this, when they plot these double reciprocals, they're able to turn their data into a linear format. And so, what's important to note, as we kind of already mentioned in our last lesson video, is that the slope of the line that forms, so notice here, the line that we get here, the slope of this line in a Lineweaver Burk plot is going to be the ratio of the Michaelis constant, , over the . So essentially will be equal to the slope of the line. And so notice over here on the left, what we have is the Lineweaver Burk equation that we introduced in our last lesson video and we know that it resembles the equation of a line. So we know that this reciprocal here is going to be the y of our line and we know that it's found on the y-axis for that reason. And so, we know that here as we said up above, we know the is going to be our slope and the slope of the line in a Lineweaver Burk plot is just going to be the ratio of the over the . So this here, is going to be the , which means that the , so the , is going to be the reciprocal of the substrate concentration and that's what goes on the x-axis of our plot. So, that's what goes down here, one over substrate concentration. And then it's gonna be plus . And we know that the is going to be the y-intercept, which is pretty much where our line crosses the y-axis. So where our line crosses the y-axis is right at this point and that's why it's called the y-intercept or . And so the y-intercept is just going to be the reciprocal of the or . And so, here what we can see is that the, y-intercept here is going to be, and that's going to be , so we can write that in here, . The x-intercept, recall, is just where our line crosses our x-axis. So where those two points meet is going to be right here, and so this is going to be our x-intercept. And the x-intercept is also going to be the reciprocal, it's going to be the reciprocal of the , however. And it's gonna actually be the negative reciprocal, so it actually has a negative sign, negative one over , whereas none of our other reciprocals have a negative sign. And the reason that it has a negative sign is because notice that our x-intercept here is falling into the negative region of our plot. So here's 0, here are the positive numbers, and then to the left are the negative numbers and so because the x-intercept falls into the negative region that's why it has a negative here. And so of course we already said that the slope of this line here is going to be and we said that it's going to be the ratio of the over the , so we can indicate that here as well. . And so really these are the most important components that we need to take note of when it comes to a Lineweaver Burke plot. Now one additional thing that I want you guys to notice is that, notice that over here on this part of our line, that it is a solid line, but over here what we have is a dotted line. And so, the reason for that is because notice that, the, in order to get into this region over here where this dotted line is, we're actually gonna need to have negative negative, substrate concentrations to get over here. And, in reality, we're not able to get negative substrate concentrations. The lowest substrate concentration that we can get is 0 and so, this here, we're never gonna actually have data that falls into this region of our graph, so it's never gonna fall into that region. Our data, that we collect from an experiment is always gonna fall over here, which is why we have this solid line here. And again, that has to do with we we can only have positive substrate concentrations. And so, the data will fall over here, but we can always draw an imaginary line, so that's what this really is, an an imaginary line that extends and where this imaginary line crosses the x-axis, that's going to be the x-intercept here where we can derive the from. And so you can see, as we mentioned up above, that from this straight line here, we're able to derive both the values for the and the , and there's different ways that we can do that. We can do it through the slope because it has the over the . We could do it through the y-intercept, which has, just the reciprocal of the , and we can do it through the x-intercept. And so, just by being familiar with the equation of a line, the Lineweaver Burk plot, the Lineweaver Burk equation, I'm sorry, and the Lineweaver Burk plot, we're able to solve a lot of problems that, teachers, like to ask on your biochemistry exam. So moving forward, we're gonna talk even more about, Lineweaver Burk plots to break them down even further. But this is a good initial introduction to Lineweaver Burk Plots, and in our next lesson video, we're going to, focus more specifically on these intercepts, the y-intercept, as well as the x-intercept. So I will see you guys in that video.